
Moving a monitoring fleet is four jobs:
- Map your existing checks to Uptimia's twelve monitor types.
- Recreate the ones bulk import cannot reach.
- Rebuild alerting and status pages.
- Switch billing.
Do them in that order. The bulk editor's own mechanics are in Bulk Operations. Status Page Visibility covers what a status page can be locked down to.
Before You Start
- Export your monitor list from your current tool. A plain list of URLs, one per line, is enough. You paste it in Step 2.
- Pick the plan that fits the fleet you are importing. Uptimia enforces plan limits per monitor at creation, so an under-sized plan imports part of the fleet and refuses the rest.
- If your origin sits behind a firewall, WAF or CDN, allow Uptimia's probes before the first check runs. See Whitelisting Uptimia's Probe IPs.
Step 1: Map Your Checks to the Twelve Monitor Types
Most tools bundle several of these into one "check". Uptimia splits them, and each type has its own plan pool.
| What you monitor today | Uptimia type | Bulk import |
|---|---|---|
| HTTP endpoint, TCP or UDP port, ping, DNS record, mail server | Uptime | Yes (web checks) |
| Certificate expiry and chain | SSL | Yes |
| Page-load timing and waterfall | Speed | Yes |
| Domain registration expiry | Domain | Yes |
| Malware scan of a URL | Virus | Yes |
| Load timings from real visitors | Real User | Script only |
| Recorded browser journey (login, checkout) | Transaction | No |
| Chained HTTP requests with assertions | API | No |
| Cron, worker or backup that pings you | Heartbeat | No |
| CPU, memory, disk and load on a host | Server | No |
| A zone at its authoritative nameservers | DNS | No |
| Domain or sending IP on spam blacklists | Blacklist | No |
The five families in the bottom half are the ones switchers most often forget they had. A dead-man's-switch service such as a cron watchdog maps to Heartbeat. A synthetic API test maps to API. See Monitoring Overview if you are unsure which type a check belongs to.
Step 2: Bulk-Import the Five Types That Support It
Bulk creation is a mode of the normal monitor editor.
- Go to Monitoring and open the type you are importing.
- Start a new monitor.
- Click Add Bulk beside the target field. A textarea replaces the single input.
- Paste your list, one target per line.
- Configure everything else on the page. These become shared settings for every row.
- Click Preview & Create.
- Review the table in the Confirm Bulk Monitor Creation modal.
- Click Create N Monitors.
The Add Bulk toggle renders for uptime, SSL, Speed, domain and virus. Add Single switches back at any point. The field is labeled per family: Bulk Website URLs, Bulk Hostnames, Bulk URLs or Bulk Domain Names. A bare hostname works in all of them, because Uptimia adds the scheme, and for uptime the bulk mode sits on the Web sub-tab only, where every row becomes an HTTP or HTTPS check and the scheme comes from the URL. TCP, UDP, ping, DNS-record and mail-server checks are created one at a time.
Paste the Export As-Is
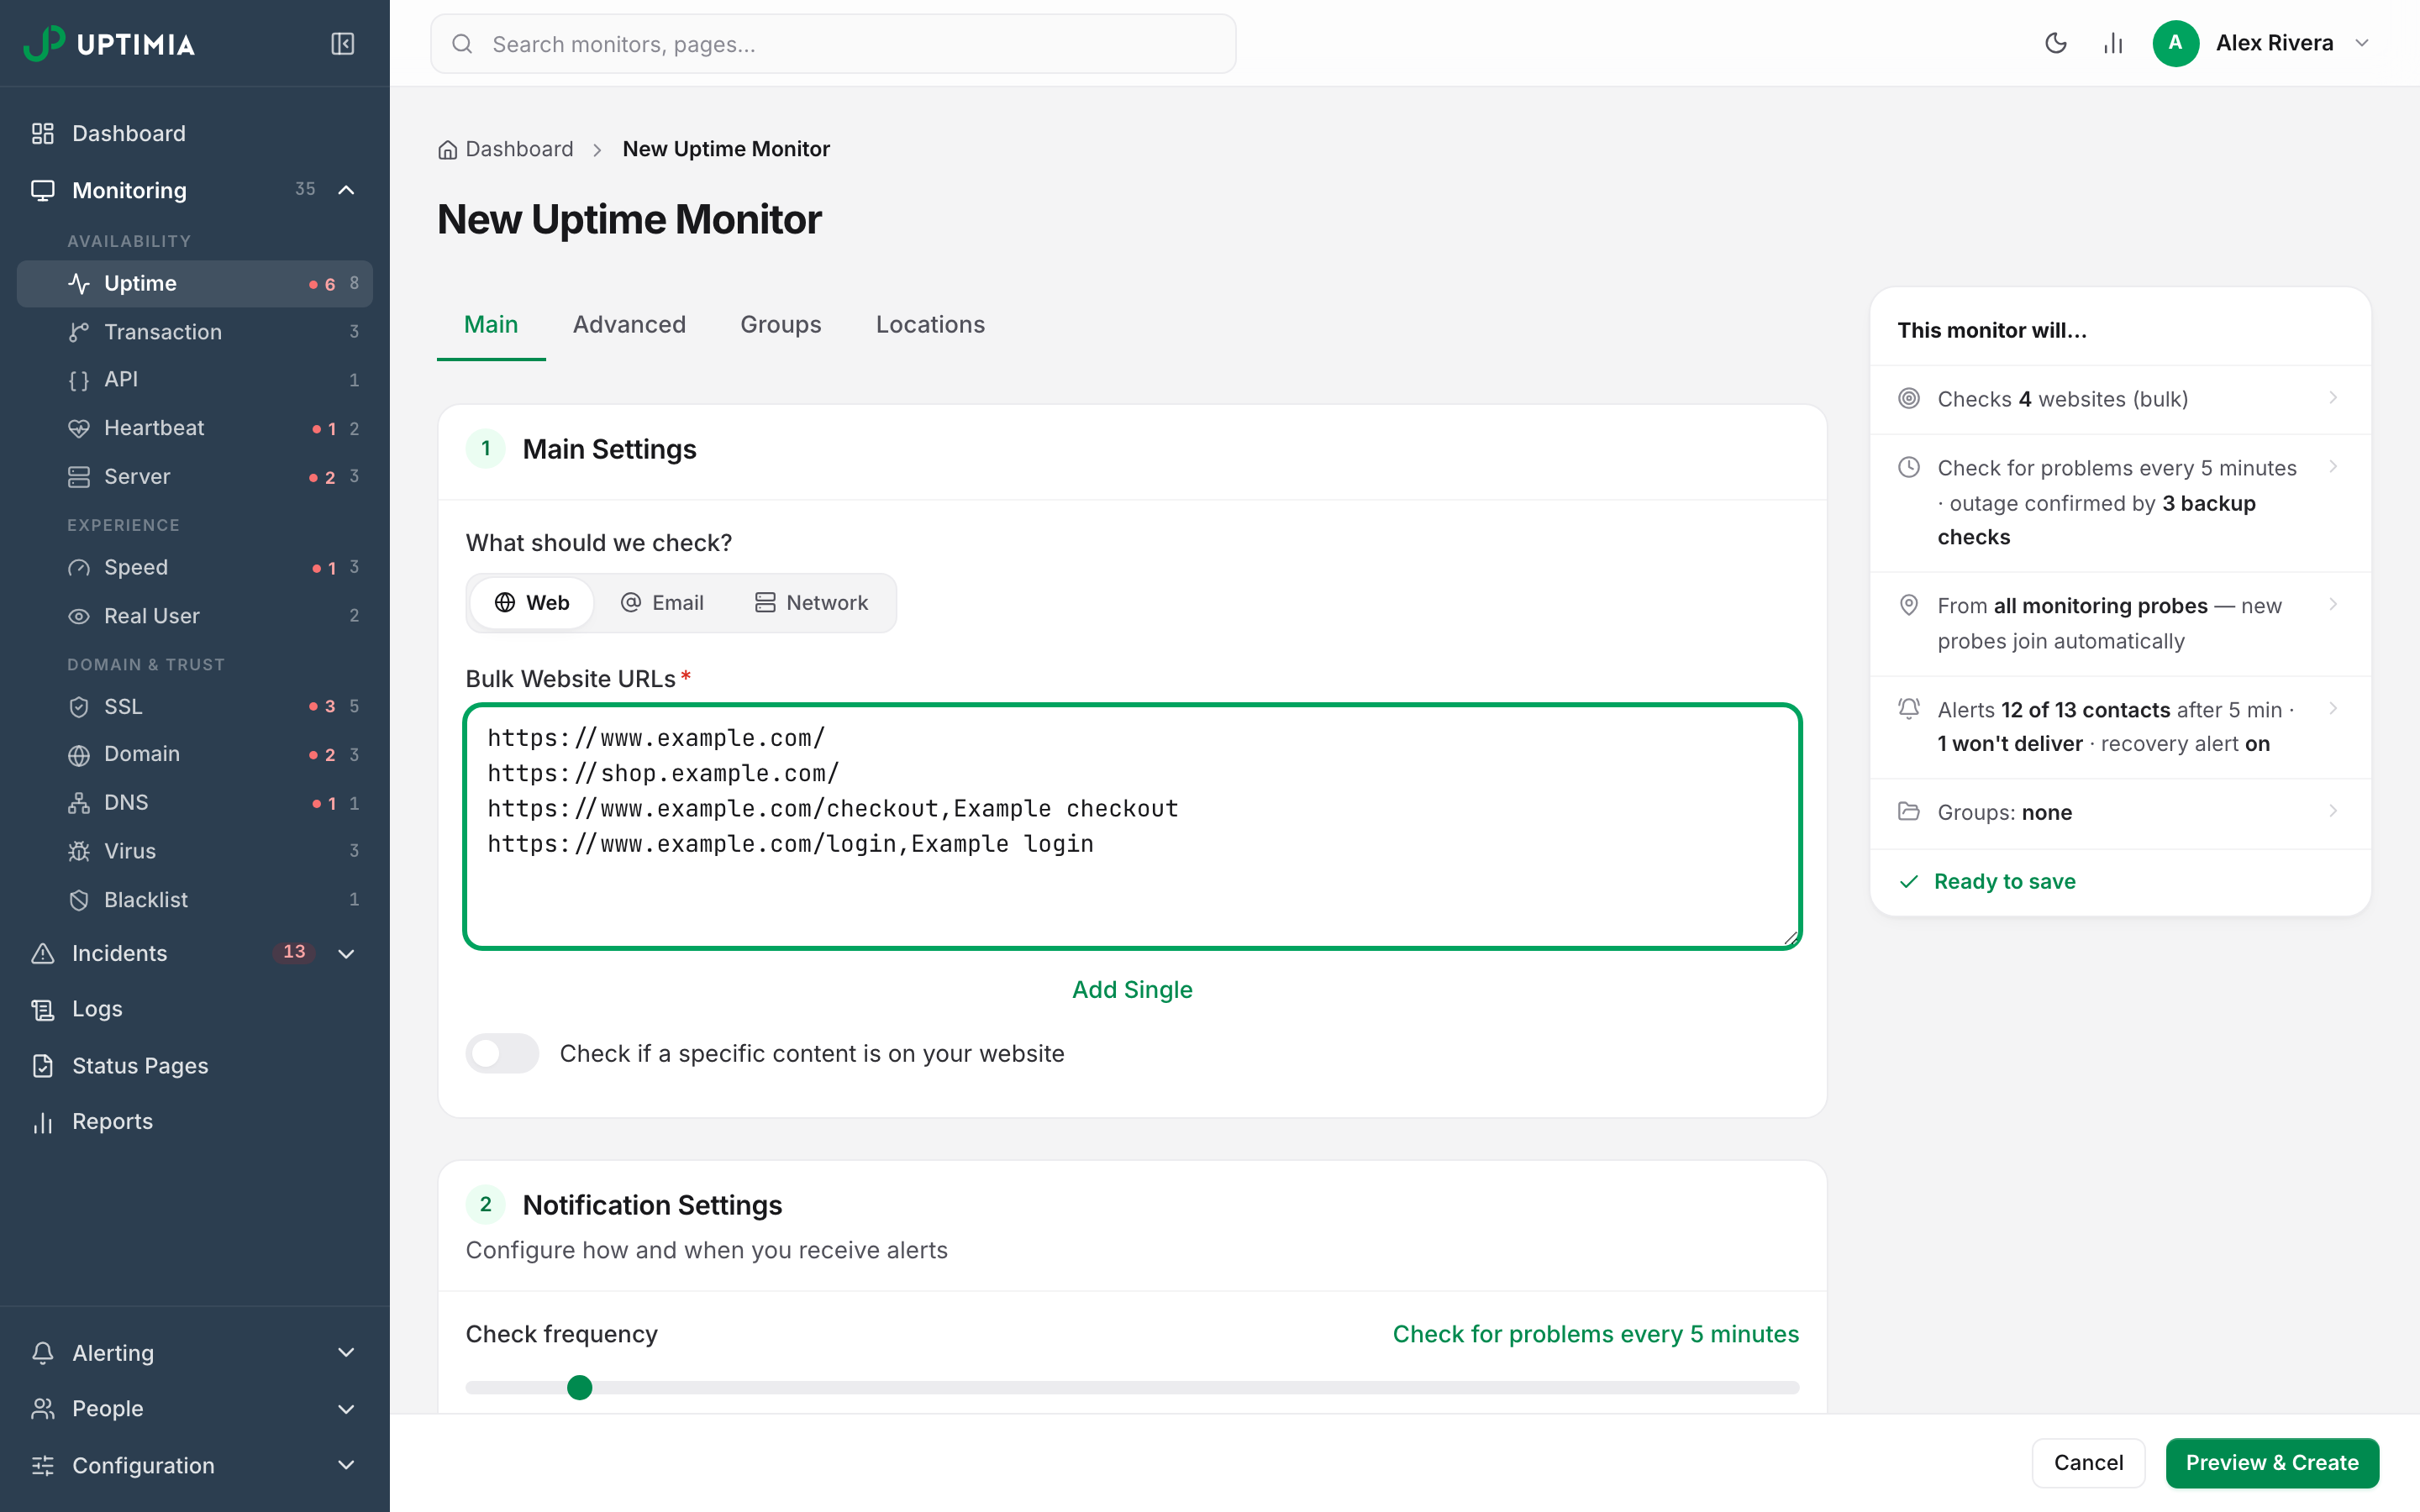
Uptimia splits each line on the first comma. With a comma, the second half is the display name. Without one, Uptimia generates the name from the URL's host, so a URL-only list imports and you never have to reformat an export into URL,Name.
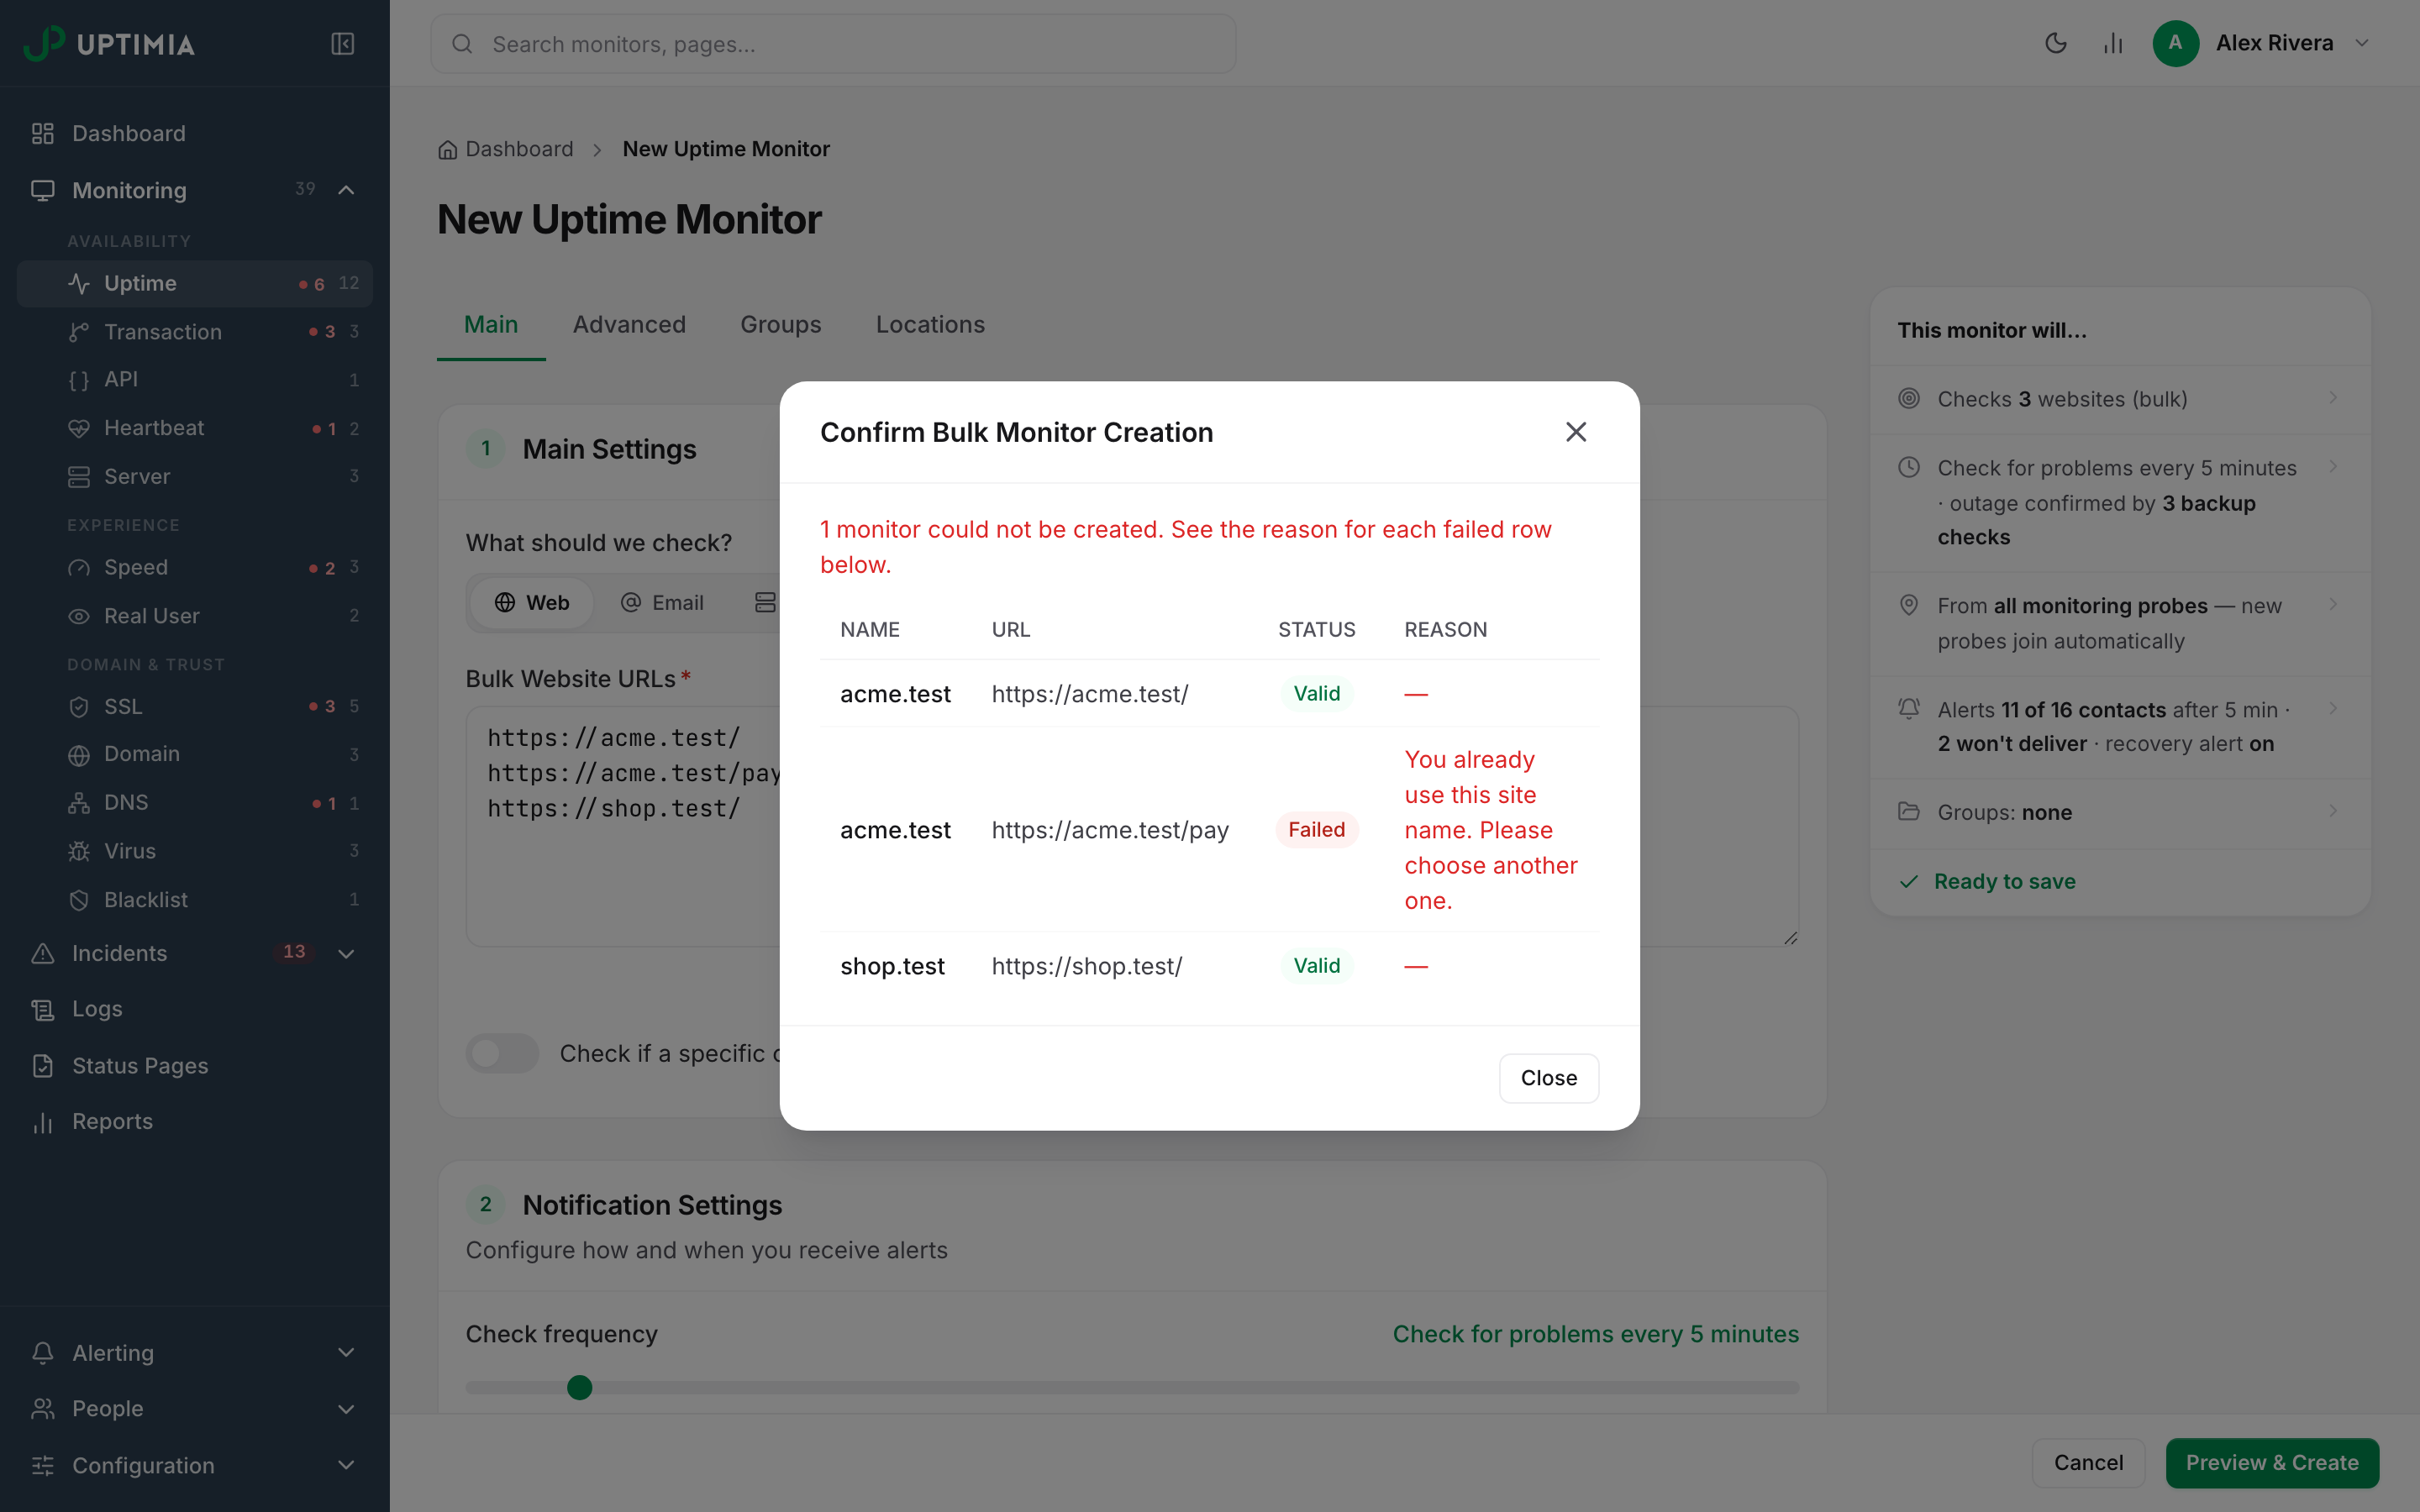
Add names only where several URLs share a hostname, because that is where the generated name collides, and Uptimia rejects duplicate names, inside the batch and against monitors you already have, with "You already use this site name. Please choose another one." Duplicate URLs go undetected. The uniqueness check is on the display name.
https://www.example.com/
https://shop.example.com/
https://www.example.com/checkout,Example checkout
https://www.example.com/login,Example login
Everything on the Page Is a Shared Setting
These settings apply to every row, along with the family's own: check frequency, alert delay, recovery alert, recipients, groups, probe selection, branding, the outage-confirmation threshold and the escalation-policy binding. For uptime that includes HTTP method and body, Basic Auth, custom headers, timeout, follow-redirects, the reported error types and the keyword check.
Notes and Unique ID are per-monitor, and bulk mode does not show them. A unique ID has to be unique inside the account, so one shared value would create the first row and fail every row after it.
Reading the Confirmation Table
The modal lists every parsed row with a Valid or Invalid badge. Validity at this point is URL format only: the preview does no duplicate or plan-limit checking.
Those checks run per row at create time. A row that would push a pool over its plan limit is refused with a message naming that pool:
- Uptime, SSL and Speed rows: "You have exceeded the maximum number of monitored sites."
- Domain rows: "...monitored domain names."
- Virus rows: "...monitored URLs."
Uptimia refuses a duplicate name with "You already use this site name. Please choose another one." It refuses a URL on its blocked-domain list too, with a different message per family. Uptime and Speed rows get "Please enter a valid site URL". SSL, domain and virus rows get "The URL is blacklisted or invalid."
Every other row is still created. The modal stays open, failed rows get a Failed badge and a Reason column, and the monitors that succeeded are already in your list.
A Better Route Than Import-Then-Edit
Some fleets need more than a URL: headers, auth, a keyword check, a specific probe set. Configure one monitor properly, open its actions menu and choose Save as Template. Then create the rest from Configuration → Monitor Templates, typing only a name and a target for each instead of hand-editing 60 imported monitors. See Monitor Templates.
For a consistent probe set across the whole imported fleet, save one under Configuration → Location Profiles first and apply it in the editor. Editing the profile later rewrites every monitor still on that set. See Location Profiles.
Step 3: Create the Families Bulk Import Cannot Reach
You create Transaction, API, Heartbeat, DNS, Blacklist and Server monitors one at a time. Each needs something a URL list cannot express: a step chain, a ping URL that Uptimia generates for that one monitor, a zone with its own watch configuration, or an installed agent. A script is the only way to create a Real User monitor. The editor offers them no bulk box.
For more than a handful, a script is faster than the editor. Create a key from the avatar menu (top right) → Settings → API Keys, a tab only Owner and Admin see; your script authenticates with it. You can do anything on this page from a script instead. See Getting Started with the Uptimia API.
The family articles cover each one directly: Heartbeat Monitoring, API Monitoring, DNS Monitoring, Blacklist Monitoring and Server Monitoring.
Step 4: Rebuild Alerting
Channels
You can create 10 integration types: Webhooks, Slack, Microsoft Teams, PagerDuty, Atlassian Statuspage, Discord, Telegram, Mattermost, WhatsApp and Twilio. Email and SMS need no integration, because you type the address or number on the contact itself, and if you publish to an Atlassian Statuspage today, keep doing it: the integration pushes component status across. Add each one under Alerting → Integrations, send the built-in test, then attach the resulting contact to monitors. See Integrations Overview.
Uptimia retired Twitter/X as an alert channel. For a public announcement, use a status page with subscribers instead.
On-Call Ladders
If you are migrating from PagerDuty, Opsgenie or a similar on-call tool, the ladder comes across as an escalation policy: ordered steps, recipients per step, a wait between them, bounded repeats, and automatic cancellation on recovery. Policies are reusable, and you can attach one to a whole bulk batch in the same editor pass. Escalation policies, incident grouping and acknowledgment require the Professional plan or above; the trial clears the gate. See Escalation Policies.
Acknowledgment is the other half. An alert carries a signed link that acknowledges the incident with no login. That pauses the ladder and fixes the timestamp your MTTA figure is measured to. See Acknowledging Incidents and MTTA.
The Team
Invite the people who were on-call in the old tool, with a role rather than a shared login: Owner, Admin, Editor, Read-only, or an Accounting / Billing seat that costs no paid seat. Editor and Read-only members can be limited to specific monitor groups.
Do that before the import if any importer will be a scoped Editor. Uptimia puts a scoped member's bulk-created monitors into that member's own scope groups, so they can always see what they created. See Inviting Team Members and Limiting a Member to Monitor Groups.
Step 5: Rebuild Status Pages
Status pages do not transfer. Create one, group monitors into named sections, upload a logo and, if you had one, point your custom domain at it. Custom domains, logos and the Footer Link toggle, which controls the Uptimia credit in the page footer, are ungated and saveable on every plan, Free included. But Uptimia serves no status page whose owner is on Free: every visitor gets a 404 until the account is on a trial or a paid plan.
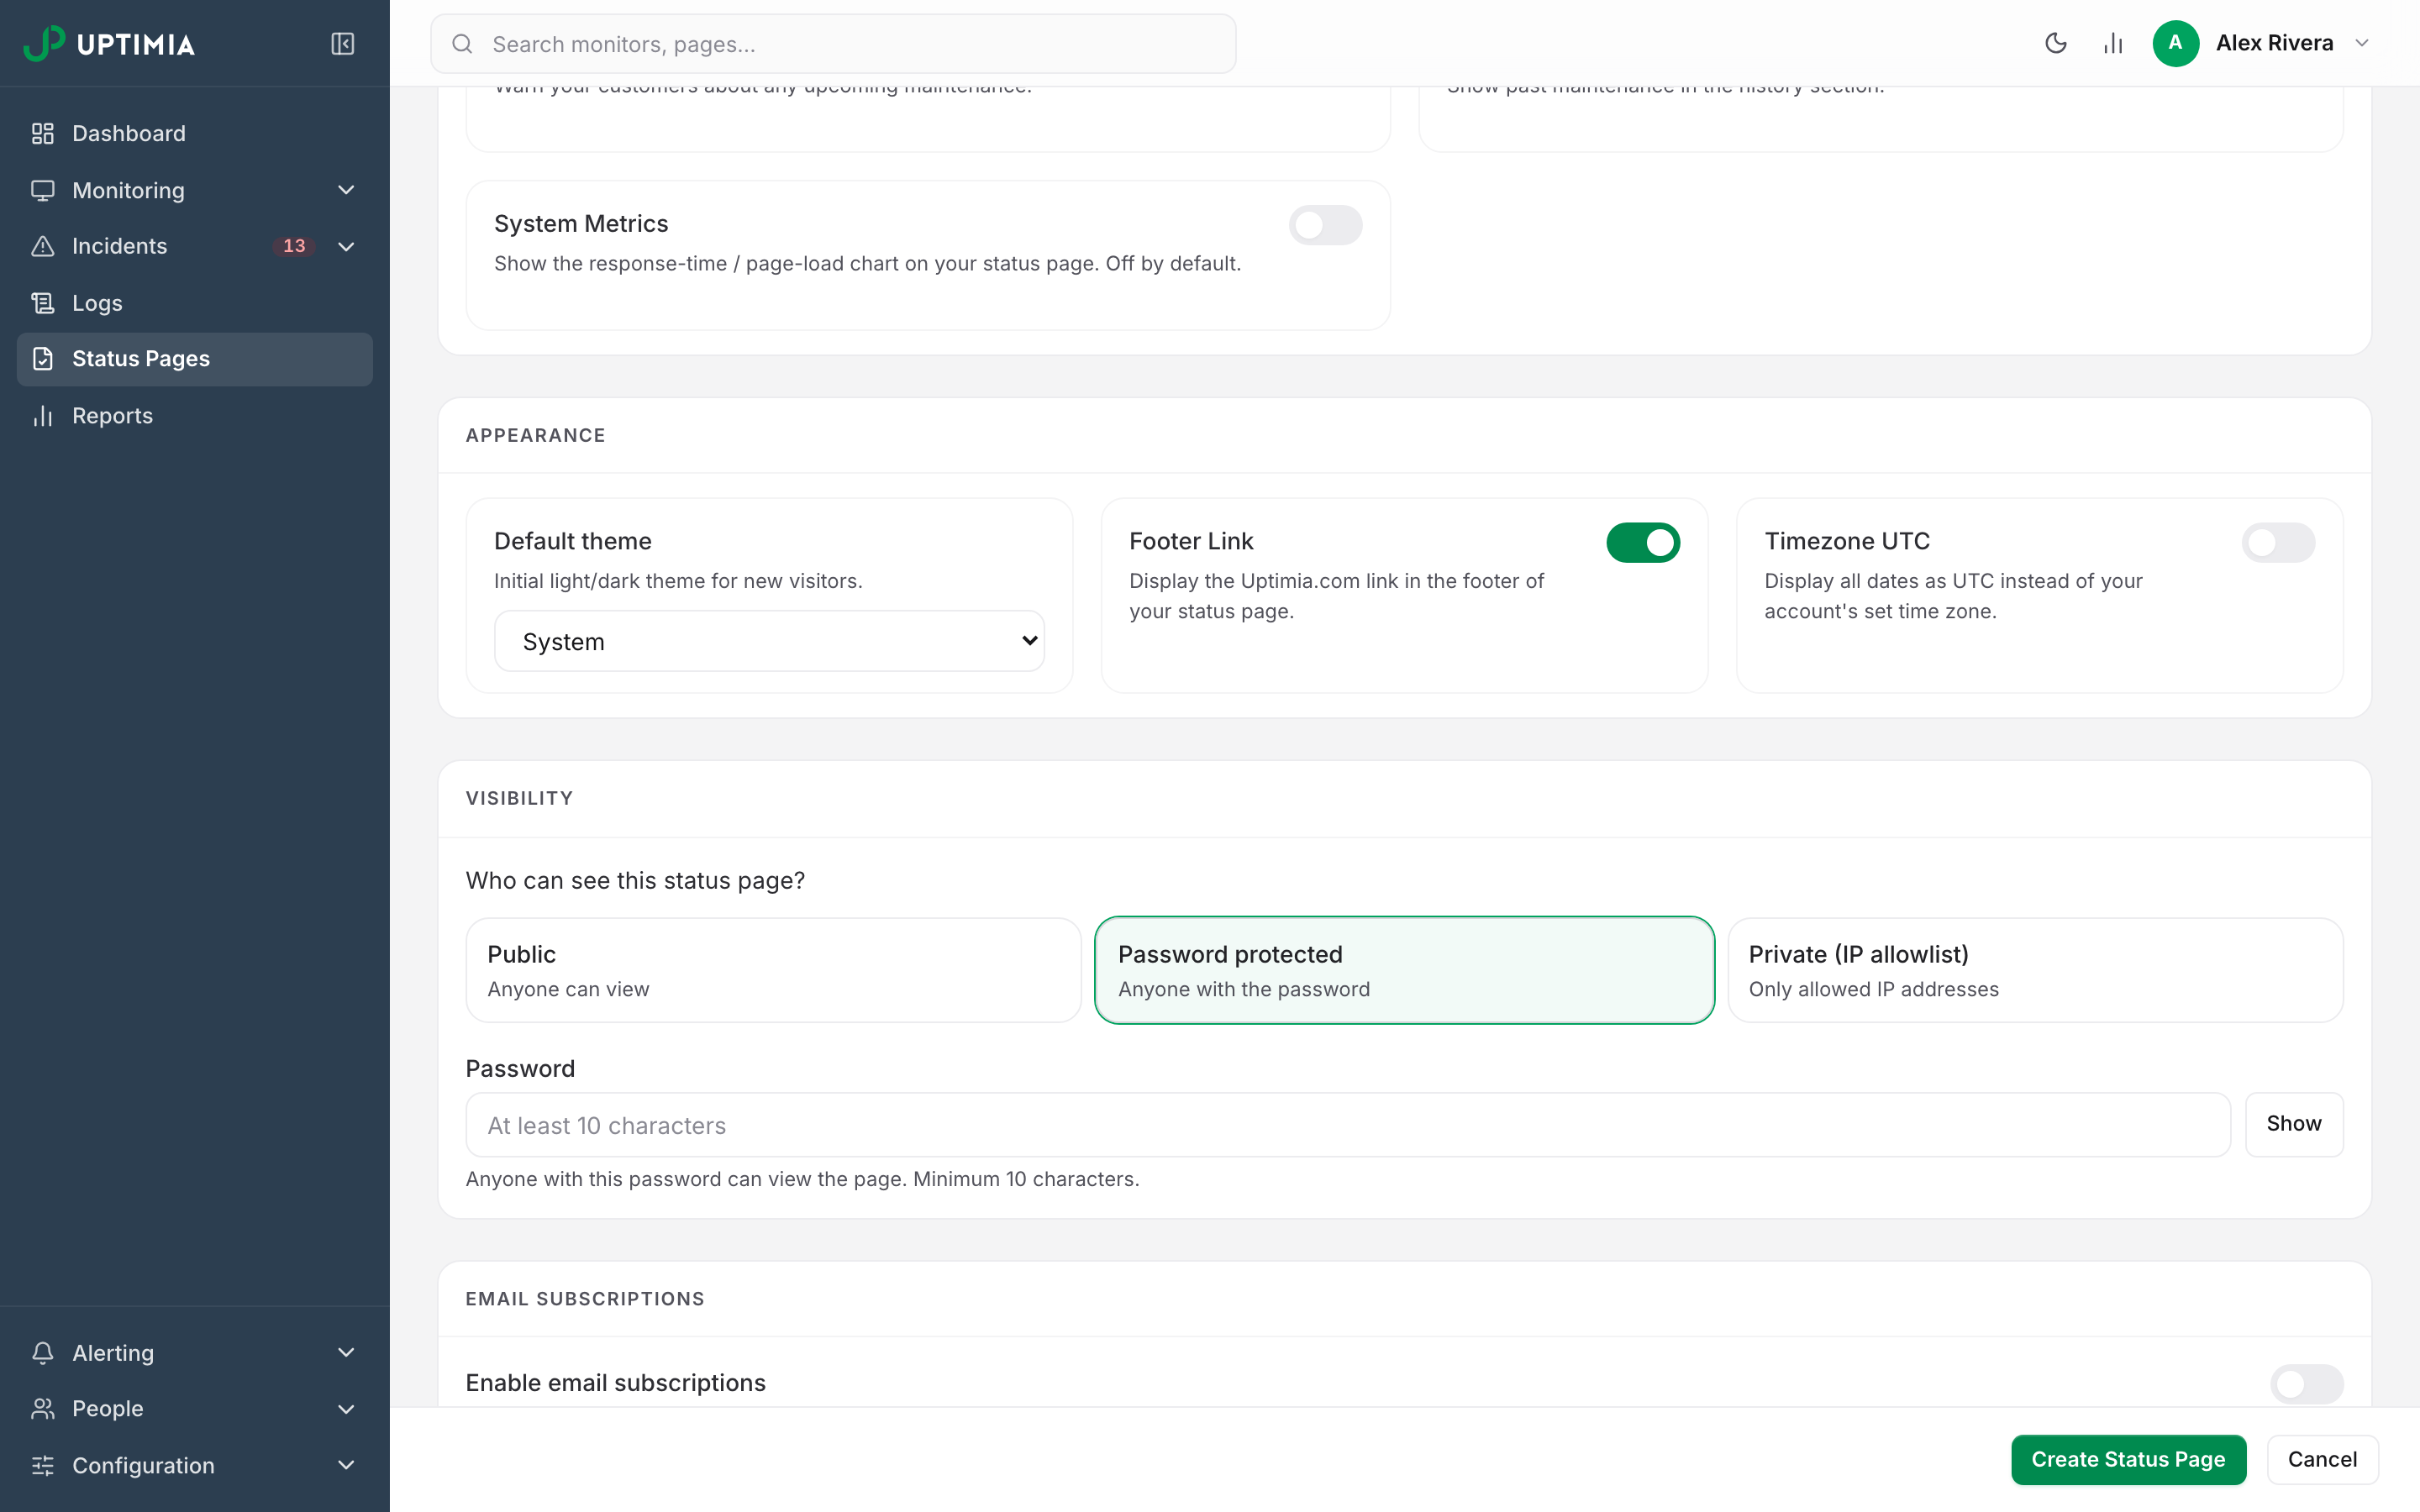
If your old provider's page was locked down, Uptimia matches it. A status page has three visibility modes:
- Public: anyone can read it.
- Password protected: one shared password of at least 10 characters unlocks the page for 12 hours.
- Private (IP allowlist): only the IP addresses and CIDR ranges you list can view it, and the list cannot be left empty.
Setting or rotating a password requires a paid plan, and so does choosing private. Removing protection is always allowed. See Status Pages and Status Page Visibility.
Step 6: Move Billing Mid-Cycle
You do not have to wait for the old subscription to lapse. Pick the plan that covers the pools you imported and switch when you are ready. Monthly and annual cycles, payment methods and invoices live under the avatar menu → Plans & Billing, which only the account Owner and Accounting / Billing seats can open. See Changing Your Plan.
Upgrade before a large import. Uptimia refuses a row that exceeds a pool, and you will be back in the editor pasting the remainder.
Running Both Tools in Parallel
Keep the old tool running until you trust the new one.
- Silence planned work in both. A maintenance window in Uptimia drops check results on arrival rather than recording them, so a cutover window leaves no incident and no dent in availability. See Maintenance Windows.
- Expect double load. Two tools checking the same origin doubles the check traffic your WAF or rate limiter sees. Widen the allowlist before the first false alert.
Once Uptimia has caught an incident your old tool also caught, and the alert reached the right channel, you can turn the old one off.
What Changes Once You're Live
History starts now. Nothing carries over from your previous provider: charts, incident history and reports build from your first Uptimia check. Your plan sets how far back they reach once they have filled, and upgrading widens that window immediately and retroactively: Free 7 days, Basic 90 days, Professional 365 days, Enterprise 730 days. See Data and Log Retention.
Detection is a two-part setting, on two tabs. Confirmations required (1–3, default 3) sets how many failures confirm an outage. It sits in the Outage confirmation card on the editor's Advanced tab, and renders for uptime, SSL, Speed, domain, transaction, API and DNS monitors. Alert delay (0–30 minutes, default 5) sets how long a problem must persist, in the Notification Settings card on the Main tab. If Uptimia seems slower to alert than your old tool, those two are why. See Getting Fewer, Better Alerts.
Probe-selected checks run from at least 6 locations. Uptime, SSL, Speed, Transaction, API and DNS monitors use all probes, or an explicit selection of 6 or more, and Uptimia refuses a smaller selection rather than quietly widening it. The other families have no probe selection.
Keyword checks are literal, and directional. You set each keyword to Must exist or Must not exist. Uptimia matches it against the response body as exact text, so if one fails after import, confirm the text is still on the live page and that the direction is the one you meant.