
If your site sits behind a firewall, WAF, CDN, bot manager or antispam service, those systems can block Uptimia's probes. A blocked probe looks exactly like an outage. Allowlist the published probe addresses over both IP protocols, exempt the Uptimia User-Agent from your bot rules, and read the evidence the probe already captured before you open a ticket. Which probes check a monitor is a separate setting, covered in Location Profiles.
Which Monitors Reach Your Infrastructure
An allowlist only helps the families whose traffic starts at an Uptimia probe. Two run in the opposite direction and need an egress rule instead.
| Family | Direction | What your rules need |
|---|---|---|
| Uptime, Speed, Transaction, API, SSL | Probes → your host | Allow the probe IPs inbound |
| DNS | Probes → your authoritative nameservers | Allow the probe IPs on UDP/TCP 53 |
| Heartbeat | Your job → https://www.uptimia.com/p/hb_… |
Allow that request outbound from wherever the job runs |
| Server | The agent → https://uptimia.com/api/v1/server/report |
Allow HTTPS outbound from the monitored host |
| Real User | Your visitor's browser → https://www.uptimiarum.eu/rum.min.js |
Allow that host in your Content-Security-Policy |
| Domain, Virus, Blacklist | Never touch your servers | Nothing |
Domain monitors query the registry, virus monitors query the Google Web Risk API, and blacklist monitors query DNSBLs. None of them is affected by your allowlist.
Get the Current IP List
Uptimia publishes every probe address at two URLs. Both list IPv4 and IPv6, neither needs an account, and both are regenerated from the same source the /checkpoints directory renders.
| URL | Format |
|---|---|
https://www.uptimia.com/monitoring-checkpoint-ips |
Plain text, one entry per line: single addresses, plus three IPv6 entries written as CIDR prefixes |
https://www.uptimia.com/monitoring-checkpoint-ips-whitelist |
The same list in nginx geo/map syntax, each line suffixed 1; |
As of 2026-08-31 the list holds 274 entries: 179 IPv4 addresses and 95 IPv6 entries. Three of the IPv6 entries are prefixes (/64 or /128) rather than single addresses.
Fetch the plain list for a change request:
curl -fsS https://www.uptimia.com/monitoring-checkpoint-ips -o uptimia-checkpoints.txt
Or wire the nginx variant straight into a config block and refresh it on a schedule:
geo $uptimia_probe {
    default 0;
    include /etc/nginx/conf.d/uptimia-checkpoints.inc;
}
15 3 * * * curl -fsS https://www.uptimia.com/monitoring-checkpoint-ips-whitelist -o /etc/nginx/conf.d/uptimia-checkpoints.inc && nginx -t && systemctl reload nginx
Point your rules at the URL rather than at a list you copied once. A stale or partial list is the most common reason for "I already whitelisted you but still get alerts".
The list includes every provisioned probe, including any that is momentarily down: a probe must already be trusted when it comes back.
Do Not Copy the Addresses From the Probe Directory
https://www.uptimia.com/checkpoints is the human-readable directory of locations, with a country, city, IPv4 and IPv6 column, and below a 900-pixel viewport the page hides its IPv6 column. Copy "every address on the page" from a tablet or a half-width window and you silently get IPv4 only. That gap produces intermittent false alerts. Not every probe has an IPv6 address either; those cells show an em dash.
Allowlist Both IPv4 and IPv6
Probes connect over both protocols, your tooling may evaluate each separately, and if you allowlist only the IPv4 set, any probe reaching you over IPv6 can still be blocked. The resulting alerts look random, because only some probes are affected. One customer added every published Uptimia IPv4 address to an Akamai allowlist and still saw dozens of probes blocked. The missing IPv6 addresses were the cause. Both published URLs carry both protocols, so fetching either one covers it.
Identify Uptimia by User-Agent
Probes send one of three User-Agent strings. All three contain the stable token Uptimia, which is the only thing worth matching on.
Non-browser checks (uptime, and the page fetch behind speed monitoring) send this exactly:
Mozilla/5.0 (compatible; Uptimia; www.uptimia.com)
Browser-driven checks send a desktop Linux Chrome string with a fixed suffix. Speed page loads, transaction steps and screenshots all use it, and the version comes from the Chromium driving the page:
Mozilla/5.0 (X11; Linux x86_64) AppleWebKit/537.36 (KHTML, like Gecko) Chrome/<version> Safari/537.36 Uptimia/1.0 (https://www.uptimia.com)
API monitors send a third, plain string:
Uptimia-ApiMonitor/1.0 (+https://www.uptimia.com)
Write your rule against the substring Uptimia. Never pin it to a Chrome version, which moves with every browser upgrade.
Anyone can spoof a User-Agent, so treat User-Agent matching as a second layer on top of IP allowlisting. Allow on the combination of the published probe IPs and the Uptimia token.
Minimum Browser Version and "Headless" Bot Rules
A minimum-browser-version rule blocks probes even from a fully allowlisted IP, which is why an IP-focused investigation misses it.
F5 BIG-IP ASM, Akamai Bot Manager, Imperva and Cloudflare's "outdated browser" protection can carry a minimum-browser-version rule. Anything below that minimum gets a block page instead of your site. Measured against an F5 BIG-IP ASM on 2026-08-21, one variable changed at a time from the same source IP:
| User-Agent sent | Result |
|---|---|
Chrome/102, /110, /116, /120, /121 |
Blocked |
Chrome/122 through /148 |
Passed |
HeadlessChrome/148 |
Blocked: the Headless token alone |
Chrome/102 with the Uptimia token removed |
Still blocked: the bot token was not the trigger |
The block page is under 200 bytes and contains none of your content. A keyword check or a transaction step then retries until its step timeout and reports your site as down.
Exempt the Uptimia User-Agent, or the probe IPs, from the browser-version and bot-signature rules as well as from rate limiting. Exempting an IP from rate limiting while a bot-signature rule still evaluates it changes nothing.
Cloudflare-Proxied Domains
If your domain is orange-clouded (proxied through Cloudflare rather than pointed straight at your server), probe requests terminate at Cloudflare's edge rather than your origin.
- Add the probe IPs, both protocols, to a WAF skip rule and exempt them from Managed Challenge, JS Challenge, rate limiting and Bot Fight Mode.
- Cloudflare may serve cached edge content, so a probe can succeed while your origin is degraded. An edge security action can also fail a probe while your origin is healthy.
- Cloudflare's events log does not always show the action that failed a probe. Read the incident's own evidence instead: when the incident stored it, the root-cause panel keeps the response the probe was served.
Country and Geo Rules
A probe's IP can geo-resolve to a different country than the city it is named for. A UK probe may be registered to another European country, so a UK-only country rule returns 403 to it. Allowlist by address rather than by country, and place the address rule ahead of the country rule.
If you deliberately block a country, do not select probes in it: a 403 from there is a correct response and a self-inflicted false positive. See Monitoring Locations and Coverage.
Narrowing Which Probes Check You
An enterprise change request does not have to name all 274 addresses, but the firewall rule still should. Pin the monitor to a saved probe set, a built-in such as Europe or EU / GDPR, or your own. The monitor is then checked only from that set.
Narrow the selection; keep the allowlist whole. 41 of the 179 checkpoints have no machine of their own: a nearby box serves them and connects from a different published address, sometimes in another country and occasionally in another region. A Ghent check comes from Amsterdam, a Riyadh check from Tel Aviv, and Doha, Manamah and Cairo all come from Istanbul. Keep the full published list in the rule, or ask support which machines serve the checkpoints you picked. You cannot select fewer than 6 probes in an explicit set. Monitoring Locations and Coverage covers which cities share a machine.
Check What the Probe Received
Before opening a ticket, read the evidence Uptimia already captured.
- Open the incident from Incidents. The root-cause panel carries whatever that incident captured: an Error responses table, a Detecting checkpoints table, and an Evidence section. Evidence holds Response headers, Response body and Traceroute. Each block appears only when the incident stored that data.
- For a single failed uptime check, go to Logs, click the failing row, and read the Response box in the check-detail slide-over. The Response box is uptime-only. The speed, transaction, API and SSL slide-overs show the check's facts and its error, not the page that came back.
- If the body is a challenge page, a block page or an "outdated browser" notice, the cause sits in your edge security layer rather than your origin. Fix the rule and the alerts stop.
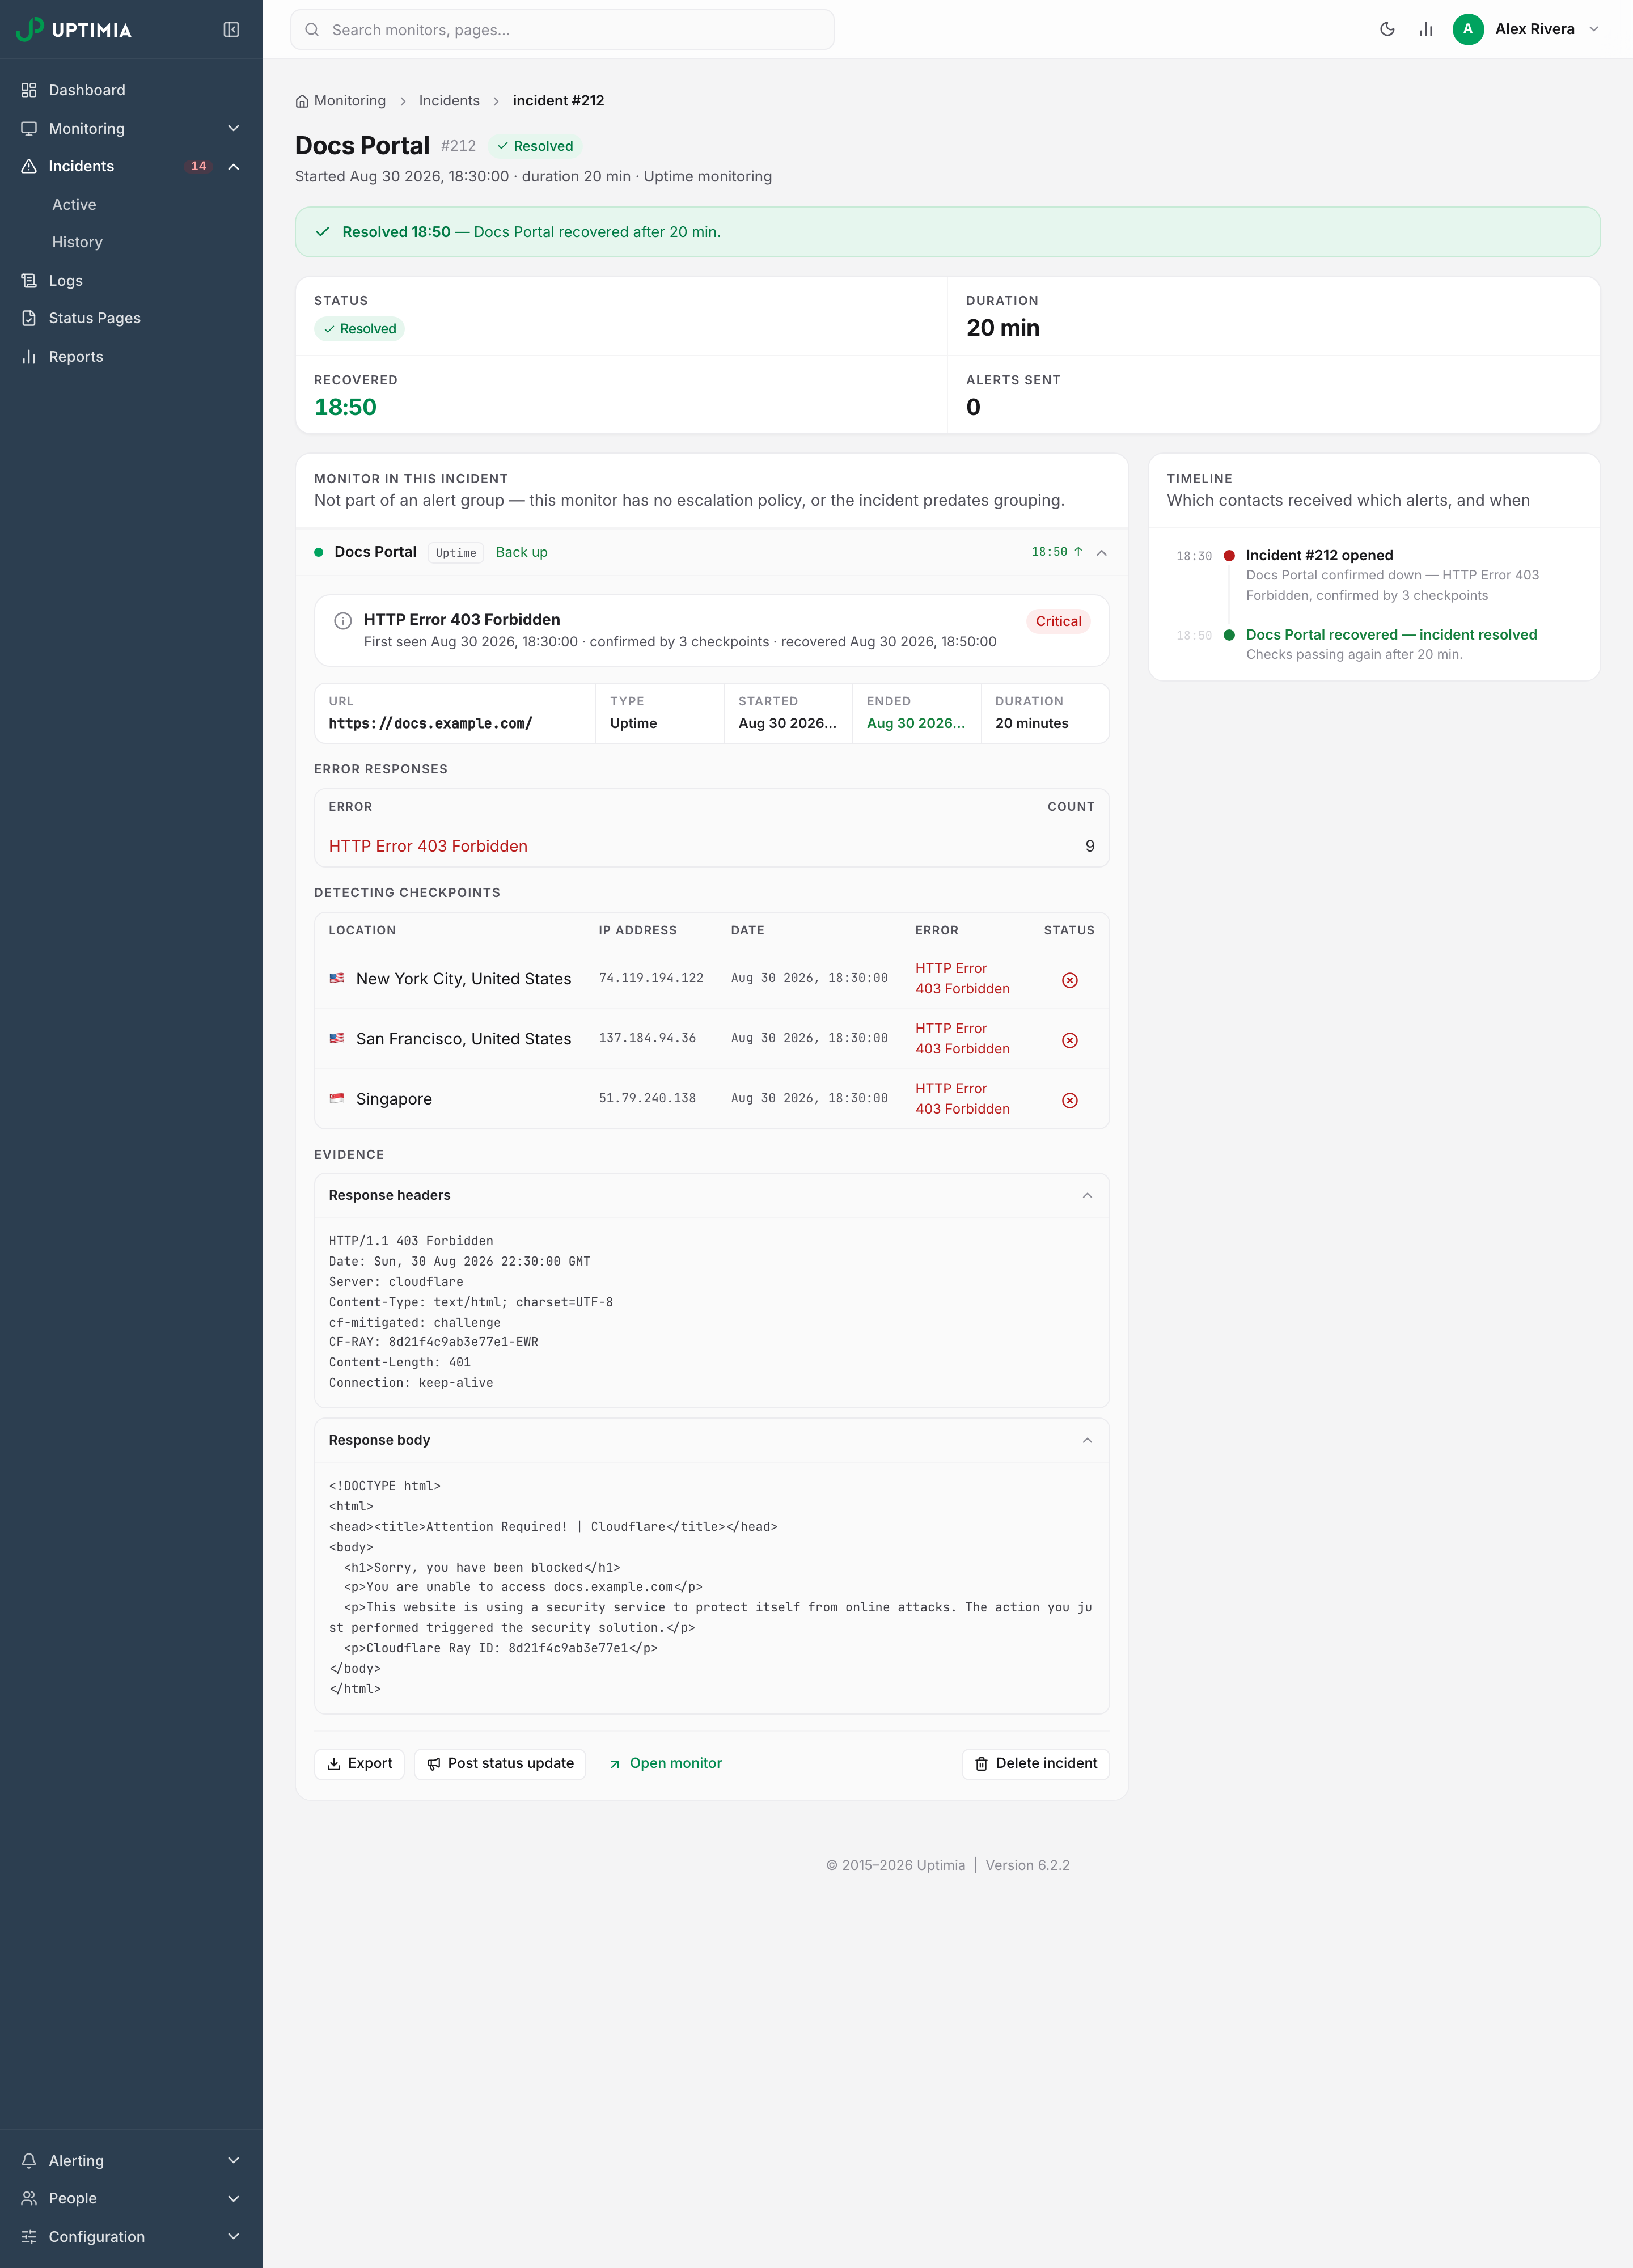
A short block page with none of your content, arriving from several probes at once, is the signature of every cause in this article.
Re-Check After New Probes Are Added
Uptimia adds new probes and new IPv6 addresses over time. If false alerts begin after a stable period, re-fetch the list and confirm every address is still covered. Pulling the list from the URL on a schedule, like the crontab line above, removes this failure mode.
Alert and Webhook Delivery Does Not Come From the Probes
Outbound alerts, webhooks in particular, come from the Uptimia application server rather than from the probes. A firewalled webhook receiver needs its own rule, and the probe allowlist will not help it.
When to Contact Support
Contact support when the probe evidence shows a plain origin error rather than a challenge or block page. Also contact support if you need the outbound address for a webhook receiver. Include:
- The monitor name and type.
- The incident link, or the timestamp of a failing check.
- Which probes reported the failure, from the Detecting checkpoints table.
- The Response body the probe received, if any.
- The security products in front of the site, and whether a browser-version or bot-signature rule is active.