
Real User Monitoring measures page load times in your visitors' own browsers. You paste one JavaScript snippet into your site. From there the snippet does the measuring, though it can sit on a live page and report nothing at all, for reasons ranging from a load event that finishes after the 3-second measurement to a Content Security Policy that blocks the collector. Check Code can also call a correct install missing. The two beacons it sends raise their own questions about what leaves the visitor's browser. Reporting surfaces and real-user alert rules are in Real User Monitoring (RUM).
Before You Start
- Real User monitors are not available on the Free plan. Basic includes 1 website, Professional 10, Enterprise 100 and the Trial 50; see Plan Limits and Quotas. Over the allowance, the save fails with "You have exceeded the maximum number of monitored sites."
- Your account email must be verified before you can create a Real User monitor.
- You need the Editor, Admin or Owner role. Read-only and Accounting / Billing seats cannot create or edit monitors.
Installing the Snippet
- Go to Monitoring → Real User.
- Click Add Monitor in the monitors panel, or Create Real User Monitor → on the explainer if you have no RUM monitor yet.
- Enter a monitor name and the Website URL, the full URL of a page that will carry the snippet, including
https://. - Click Save Monitor. The Install Tracking Script modal opens with your snippet.
- Click Copy, then paste the snippet into your site's HTML before the closing
</head>tag, on every page you want measured. - Click Done. The monitor page repeats the snippet in a banner with its own copy button and a Check Code button.
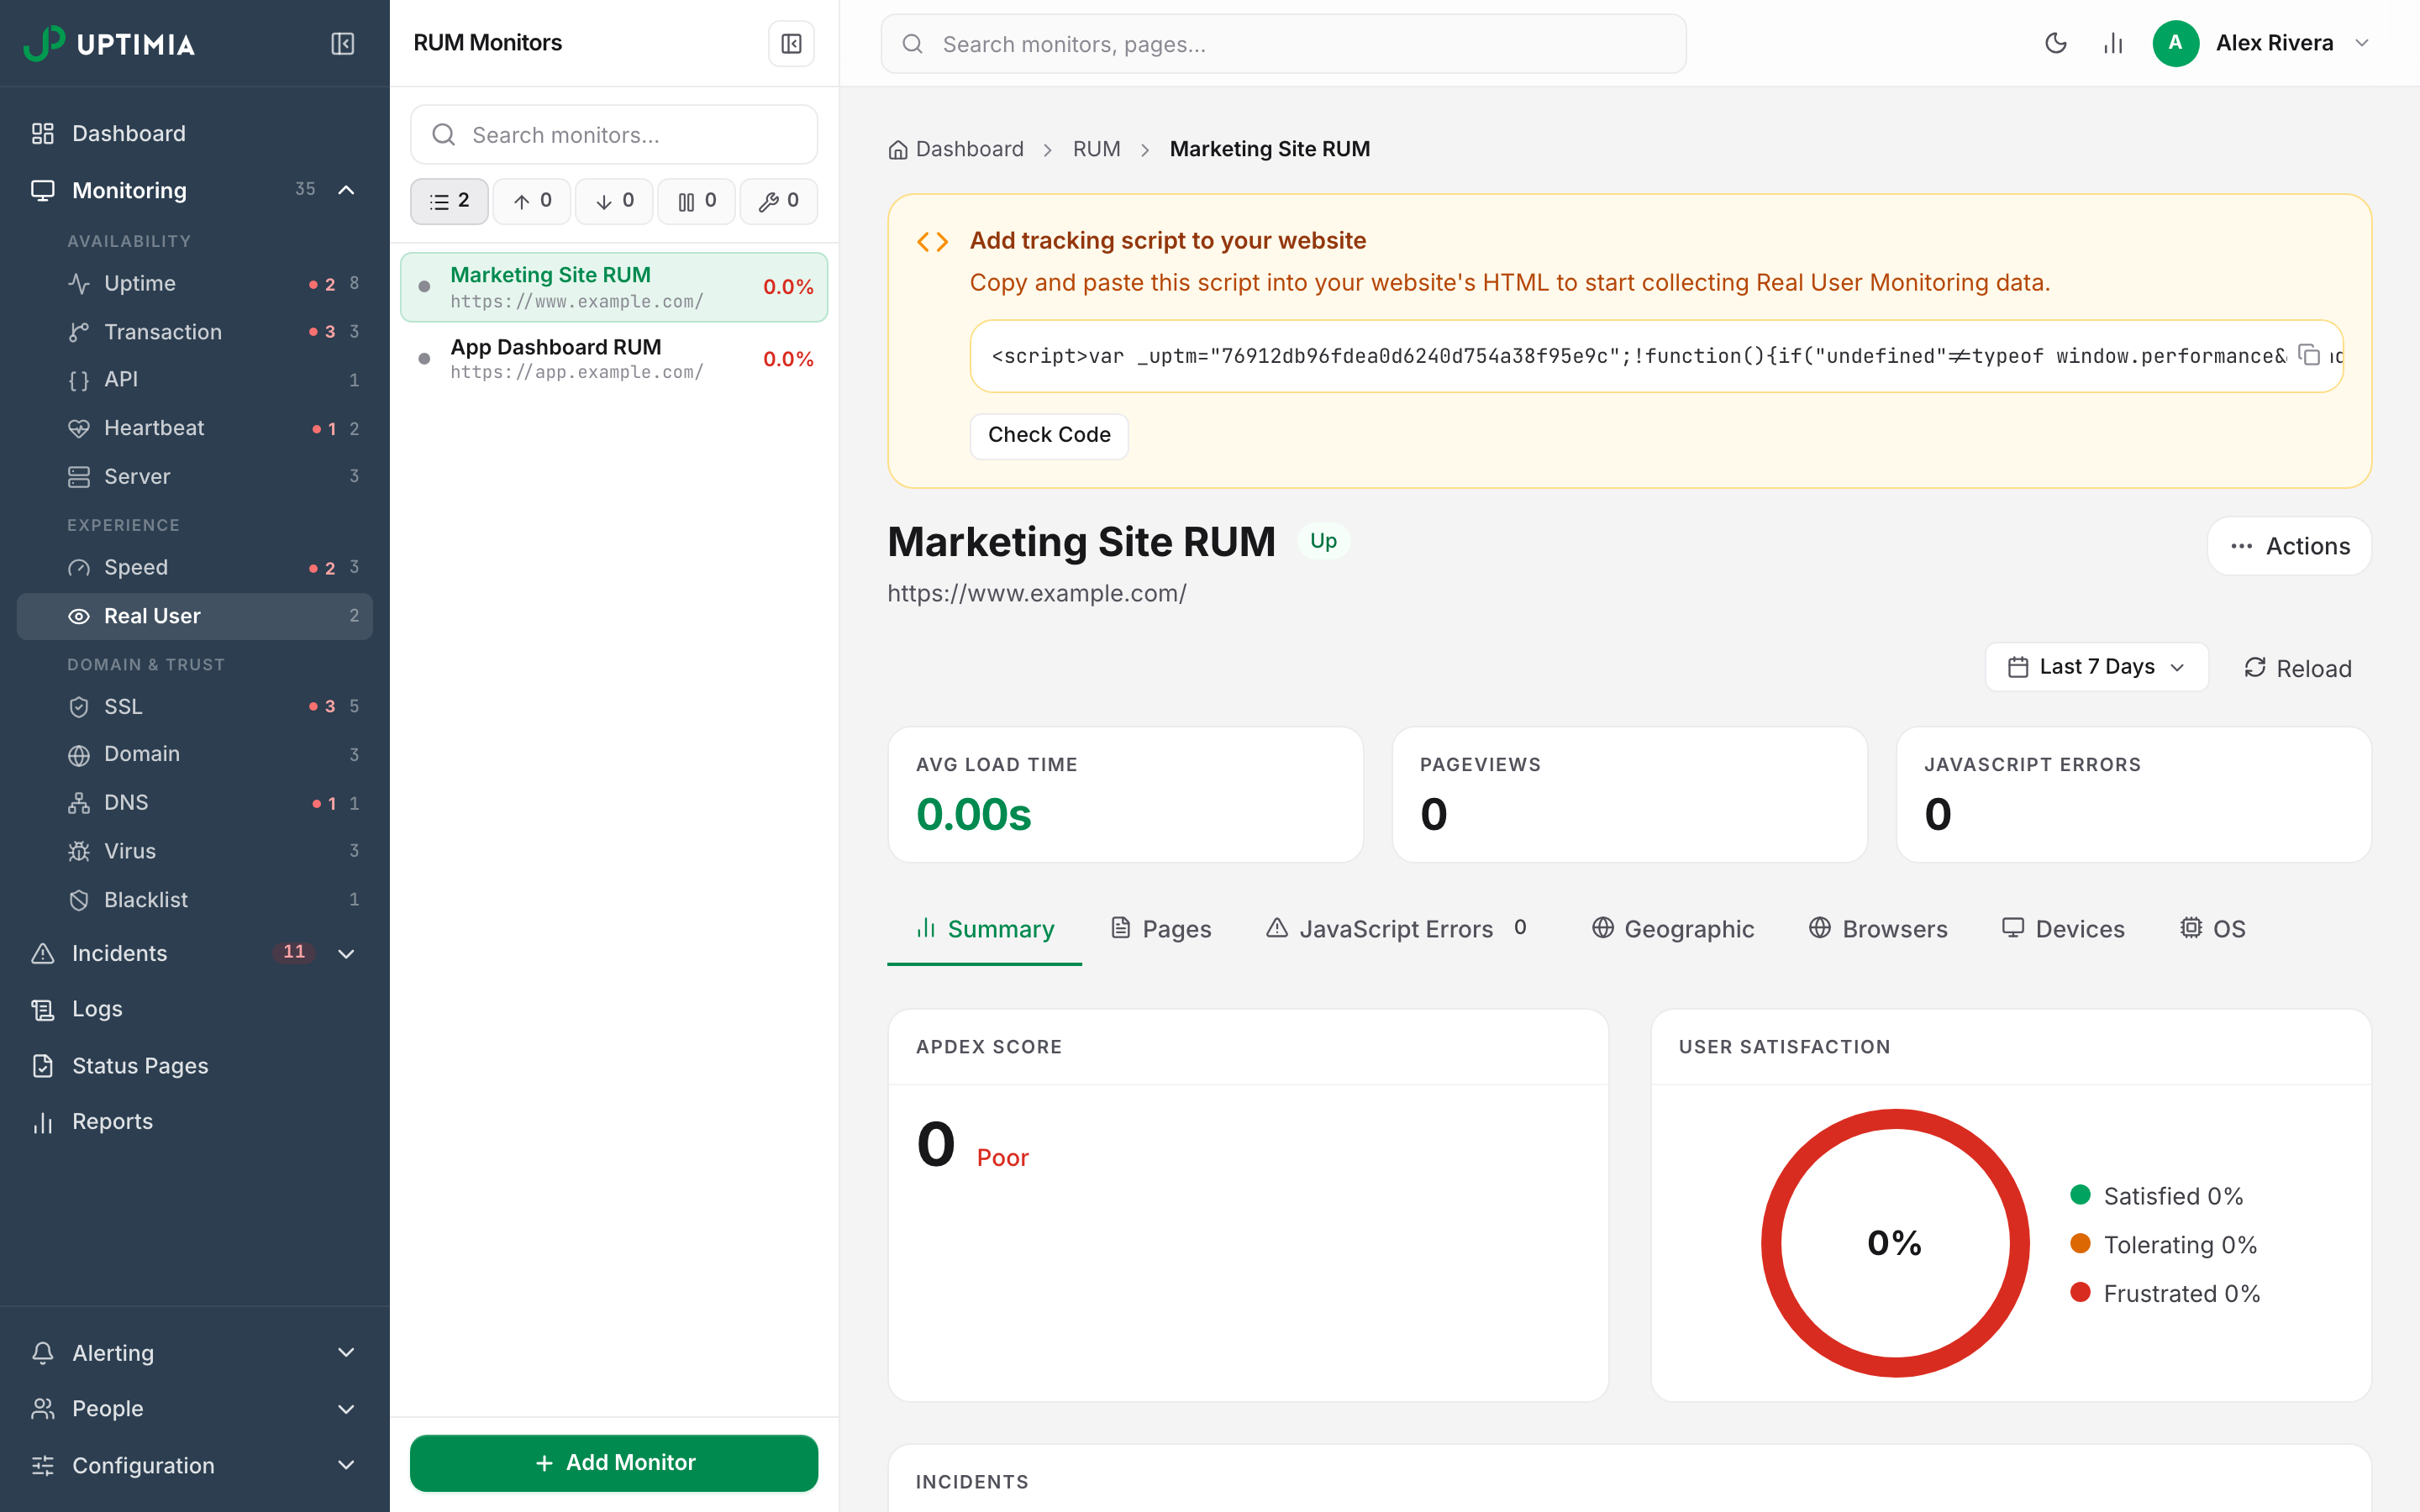
Publish the change. Data starts with the next visitor; there is no schedule and no check frequency to set.
What the Snippet Does
The snippet is an inline script that sets a variable named _uptm to your monitor's script hash. It then appends https://www.uptimiarum.eu/rum.min.js to the document head and installs a window.onerror handler.
The collector waits 3 seconds, then posts one pageview beacon to https://www.uptimiarum.eu/rum-receive/<your script hash>. Errors post to /rum-receive-errors/<your script hash> on the same host. The hash identifies the monitor, so Uptimia files everything reported against that one monitor.
One Snippet Per Site
Install each monitor's snippet on the single site it was created for. Two sites sharing one snippet report into one monitor and mix together in the Pages table. Check Code only fetches the Website URL you configured, so it cannot tell you the snippet is live elsewhere.
Editing a monitor's name, URL or alert rules keeps the same script hash, so an installed snippet keeps working. Deleting a monitor and creating a replacement mints a new hash. The old snippet keeps firing, but nothing files its data any more. Replace it with the new one.
Verifying the Install With Check Code
Check Code does not wait for traffic. Uptimia fetches your configured Website URL from its own servers and searches the returned HTML for your script hash. On a match, the amber banner turns into a green strip reading "Tracking script verified successfully." and the Check Code button disappears, so there is nothing left to re-run. On no match, the banner heading changes to "Tracking script not found" and a red Not found chip appears beside the button.
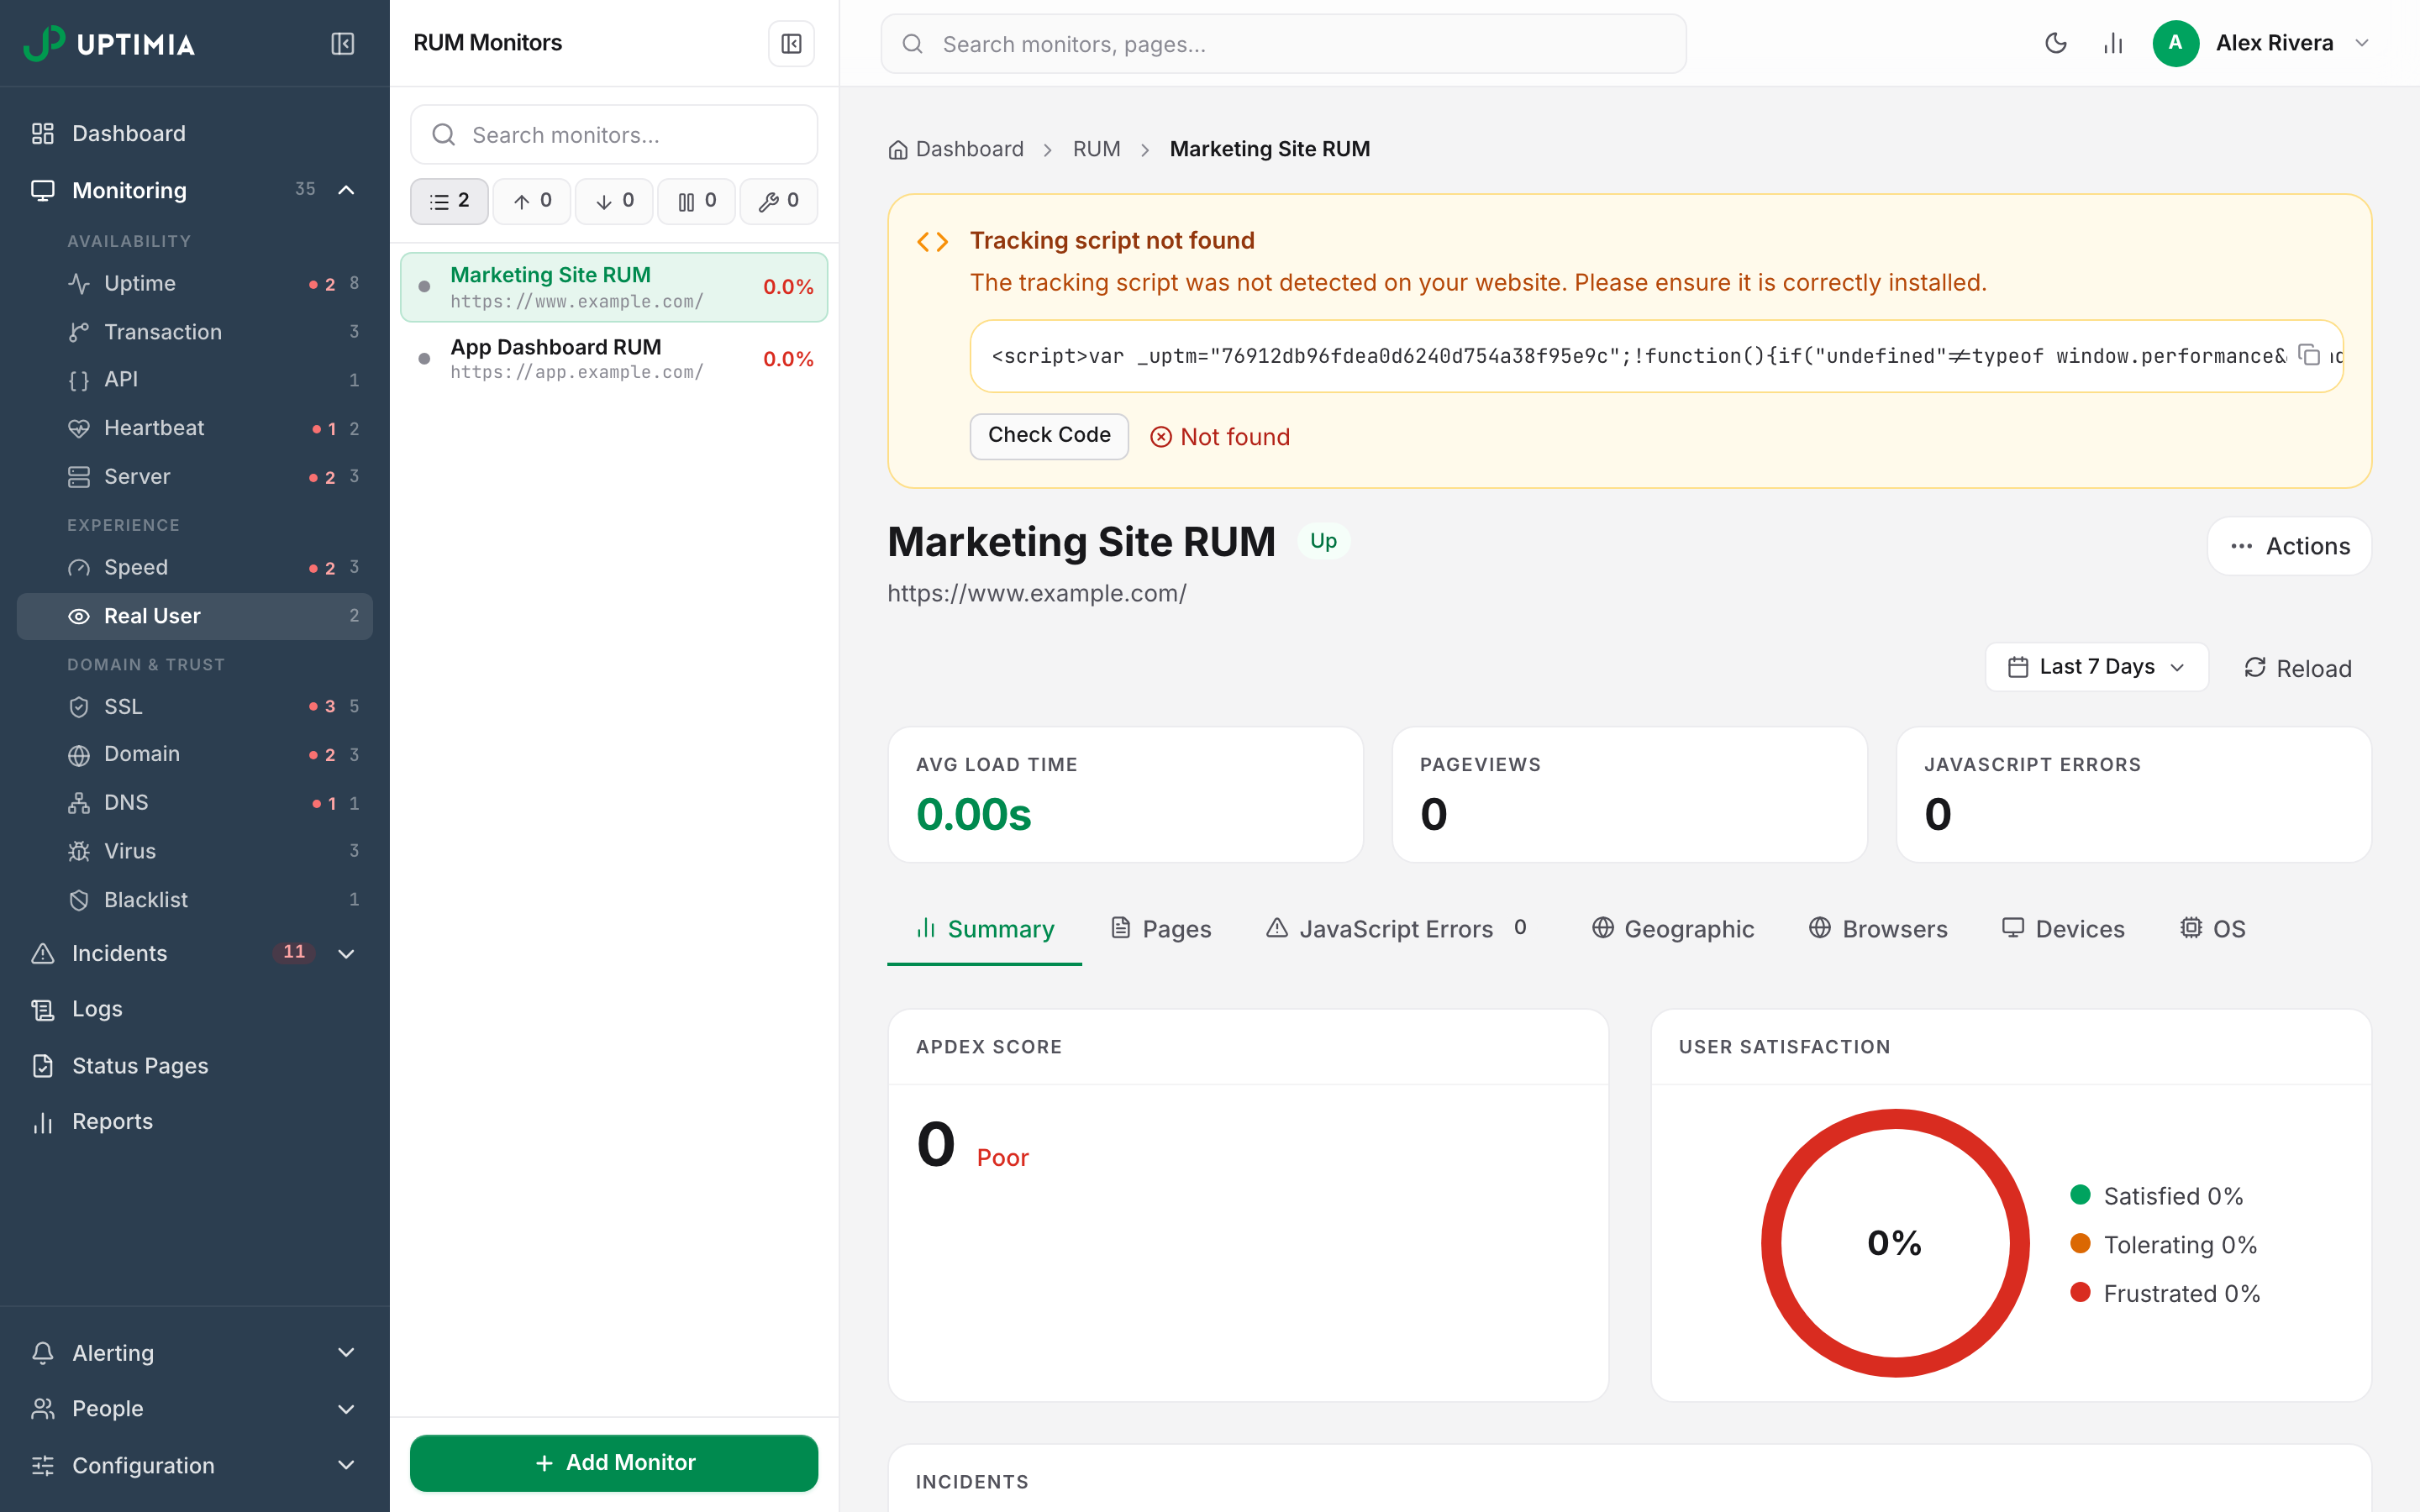
Why Check Code Fails on a Correctly Installed Site
Every cause below produces the same result, "Tracking script not found". Either the fetch could not run, or it returned HTML without the hash.
| Cause | What is happening | Fix |
|---|---|---|
| The URL redirects | The fetch does not follow redirects. An http:// URL that 301s to https://, an apex that redirects to www, or a missing trailing slash validates against the redirect response. That response carries no HTML. |
Set Website URL to the final URL, the one that returns 200 directly. |
| The site is on a private address | The fetch refuses loopback, link-local, private-range, cloud-metadata and other reserved addresses. A staging site on localhost or a 10.x address can never validate. |
Verify on a public URL, or confirm from the browser instead. |
| The certificate does not validate | The fetch verifies both certificate and hostname, so a self-signed or expired certificate aborts the request. | Fix the certificate, or confirm from the browser instead. |
| A bot filter is in front | The fetch sends no User-Agent header, so a WAF rule that requires one serves a challenge page instead of your HTML. |
Allow the request, or confirm from the browser instead. |
| The snippet is injected client-side | The search runs against the raw HTML your server returns, so a snippet added by a tag manager or rendered by a framework is not in it. | Confirm from the browser instead. The monitor still collects normally. |
| The URL carries credentials or another scheme | A URL with a username or password in it, or any scheme but http and https, is rejected. |
Remove the credentials; use http or https. |
| The snippet is on a different page | Uptimia fetches only the configured Website URL, never your whole site. | Point Website URL at a page that carries the snippet. |
The connection also times out after 10 seconds.
Confirming From the Browser Instead
This works for every cause listed, including the ones Check Code cannot reach.
- Open an instrumented page with developer tools on the Network tab, and reload.
- Filter the requests on
uptimiarum. - Confirm
rum.min.jsreturns status code 200. - Wait 3 seconds and confirm a POST to
rum-receive/followed by your script hash.
If both appear, the install is correct whatever Check Code says.
Content Security Policy and CORS
A strict Content Security Policy is the most common reason a correctly pasted snippet does nothing. The console names the blocked URL in each case.
| Directive | Why it applies | What to allow |
|---|---|---|
script-src |
The snippet appends the collector as a <script> tag |
https://www.uptimiarum.eu |
connect-src |
Both beacons are XMLHttpRequest POSTs |
https://www.uptimiarum.eu |
script-src (inline) |
The snippet itself is an inline script | 'unsafe-inline', or add your nonce to the snippet's <script> tag |
A minimal header that permits all three:
Content-Security-Policy: script-src 'self' 'unsafe-inline' https://www.uptimiarum.eu; connect-src 'self' https://www.uptimiarum.eu
CORS behaves differently from what its error message suggests. The beacons are form-encoded POSTs, which browsers send as simple requests with no preflight, so a cross-origin console error on rum-receive means only that your page was blocked from reading the response. The POST still reached Uptimia and the data still counted. Treat a CSP message as a real block. The CORS message on the beacon is noise.
Why No Metrics Appear
Work through these in order.
- No traffic yet. RUM reports only when visitors load instrumented pages, so a monitor created minutes ago on a low-traffic page legitimately shows nothing. Speed Monitoring is the family that produces load timings without visitors.
- The load event finished too late. The collector measures once, 3 seconds after it loads, and sends nothing if the page's
loadevent has not fired by then. The slowest pages are the ones most likely to go unreported. - The site is a single-page app. The collector measures only the initial document load. Client-side route changes fire no new pageview. An app that loads once and navigates internally reports one pageview per visit, not one per screen.
- CSP is blocking the script or the beacon. Allow
https://www.uptimiarum.euin bothscript-srcandconnect-src, and allow the inline snippet itself. - The pageview allowance is used up. Compare the account's pageview total against your plan's allowance in the table below. That total counts every Real User monitor on the account. Nothing on the monitor itself says the allowance ran out, so read that total rather than the monitor's status badge.
Pageview Allowance
| Plan | RUM websites | Pageviews per period |
|---|---|---|
| Free | 0 | 0 |
| Trial | 50 | 500,000 |
| Basic | 1 | 150,000 |
| Professional | 10 | 750,000 |
| Enterprise | 100 | 7,500,000 |
The current figure is on the Plans & Billing page, as the RUM pageviews pool. Only Owner and Accounting / Billing seats can open that page, so an Editor or Admin has to ask one of them for it. See Plan Limits and Quotas for every other pool.
Reading the JavaScript Errors Tab
The JavaScript Errors tab is four stat cards over two tables. There is no chart on this tab.
| Card | What it counts |
|---|---|
| Total Errors | Every error reported in the selected date range |
| Unique Errors | The number of distinct error names |
| Affected Pages | The sum of the per-error Affected Pages column. A page hitting three different errors counts three times, so read the per-row figure for a real count |
| Error Rate | Total errors divided by total pageviews. One pageview can throw several errors, so this can exceed 100% |
Errors by Name lists Name, Count, Affected Pages and Rate. Errors by Script lists Script, Count and Last Seen.
Click a row in Errors by Name. The Error Details modal opens with aggregate figures for that one error group: Error Name, Count, Affected Pages, Rate, Last Seen and Stack Trace. Individual occurrences stay out of it, along with line numbers and column numbers, and the modal splits nothing by browser or OS, both of which live on the separate Browsers and OS tabs.
The "No Stack Trace Captured" State
Most rows show "No stack trace captured for this error." in place of a trace. That is the normal state, and nothing is broken. The error beacon carries four values: the message, the script URL, the line number and the column number. The browser also offers window.onerror the Error object holding the stack, but the collector does not send it, so the Stack Trace block shows a trace only in the rare case where the analytics service supplied one.
What Error Capture Does and Does Not Include
Captured: uncaught exceptions that reach window.onerror.
Not captured:
- Unhandled promise rejections, which fire
unhandledrejectionrather thanwindow.onerror. - Anything your own
try/catchhandles, and anything logged withconsole.error. - Failed resource loads: a broken image or a 404 on a script fires an error event on the element, not on
window. - CSP violations.
Two behaviors to expect on top of that. Code of your own that assigns window.onerror after the snippet has run replaces the Uptimia handler, and reporting stops. Chain to the previous handler instead of overwriting it. An error from a cross-origin script arrives as Script error. with no source or line, unless that script is served with CORS headers and loaded with crossorigin.
What the Snippet Collects
Two beacons, both form-encoded POSTs, both to www.uptimiarum.eu.
The Pageview Beacon
Sent once per document load, 3 seconds after the collector runs.
| Field | What it carries |
|---|---|
url |
The full URL of the page, including its query string |
domtm, rendertm, dnstm, redirecttm, connecttm, waittm, transfertm |
Seven Navigation Timing durations: DOM build, render, DNS lookup, redirect, connect, server wait and transfer |
session_id |
A 32-character random value generated per page load from the browser's crypto API |
navi.userAgent |
The user-agent string: browser, engine and operating-system versions |
navi.language |
The browser's preferred language |
navi.platform |
The operating-system platform string |
navi.webglvendor, navi.webglrenderer |
The unmasked WebGL vendor and renderer: the graphics driver and GPU model. Empty when the browser withholds the WEBGL_debug_renderer_info extension |
navi.cpuClass |
The legacy cpuClass value, or Firefox's oscpu architecture string. Chromium browsers and Safari define neither, so the field is omitted from the beacon there |
navi.appName, navi.appVersion, navi.useragentVendor, navi.useragentVendorSub, navi.useragentProduct, navi.useragentProductSub |
Read from properties no current browser defines, so they are omitted from the beacon |
The snippet sends no location field. The ingest service adds the country attribution shown in the Geographic tab.
The Error Beacon
Sent whenever an uncaught exception reaches window.onerror.
| Field | What it carries |
|---|---|
error |
The error message |
script_url |
The URL of the script that threw |
line_number, column_number |
The position in that script |
session_id |
The same per-page random value |
Cookies and Identifiers
The snippet sets no cookie. It writes nothing to local storage either, and session_id lives in a page-scoped JavaScript variable that every page load regenerates, so the value cannot follow a visitor from one page to the next. Neither beacon carries a persistent or cross-site visitor identifier, or any form or input content.
Warning: the url field carries the full page URL, query string included. If your URLs carry personal data in the query string (an email address, an order number, a password-reset token), that value leaves the browser in the beacon. Strip it, or leave those pages uninstrumented.
The user-agent, language, platform, GPU and architecture fields together form a browser fingerprinting surface. Treat RUM as analytics-class instrumentation when you decide what your consent banner covers.
Your Role Under GDPR
RUM runs on your site and measures your visitors, so you are the data controller and Uptimia is the processor acting on your instructions. Disclose RUM in your privacy policy, and name the fields the two beacons carry. Apply the consent regime you already apply to analytics-style instrumentation.
Uptimia publishes its standard Data Processing Agreement at /legal/dpa, so you do not have to request it. Uptimia's public GDPR page states that customer data, monitoring results and billing records sit in EU data centers in France and Germany. Read Security, Privacy and Compliance for the wider picture across all twelve monitor families.
When to Contact Support
Contact support in two cases: when both beacons appear in the Network tab but the monitor shows no data after a day of real traffic, and when you need written confirmation of RUM data hosting for a compliance review. Include:
- The monitor name and its Website URL.
- One page URL where the snippet is installed and a visitor has loaded it.
- The status code of
rum.min.jsand of the POST torum-receive/, from your browser's Network tab. - The date, time and time zone of a visit you expected to see, plus any CSP violation text from the console, verbatim.