
Uptimia ships twelve monitor families, each watching a different thing, so pick the family by what it checks. If two look alike, see Choosing Between Monitor Types.
The Twelve Families at a Glance
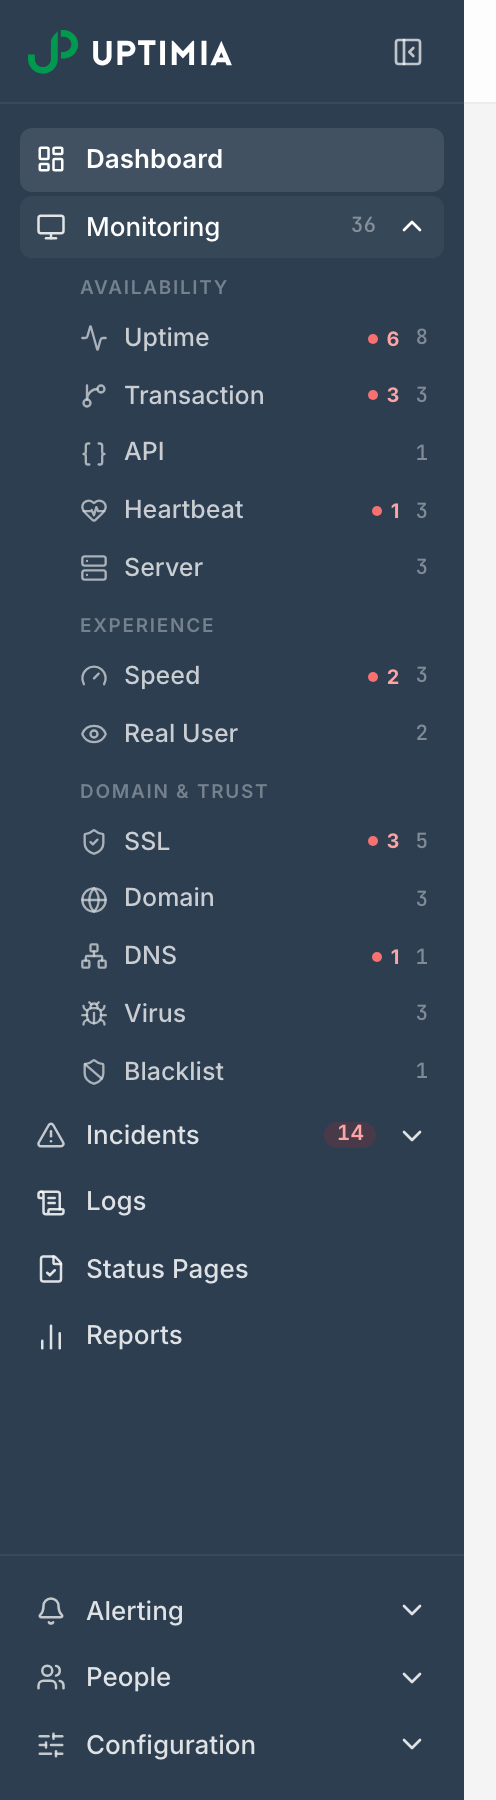
The control panel groups the twelve into three sets, and the order below matches your sidebar. Click Monitoring to expand the list. The Monitoring row carries your fleet total, and each type you already use shows its own count.
| Family | Group | What one monitor watches |
|---|---|---|
| Uptime | Availability | One endpoint over HTTP, HTTPS, TCP, Ping, DNS, UDP, SMTP, POP3 or IMAP |
| Transaction | Availability | A recorded multi-step browser journey, replayed on a schedule |
| API | Availability | An ordered chain of HTTP requests with assertions and variables |
| Heartbeat | Availability | An inbound ping your job sends: Uptimia alerts when it stops |
| Server | Availability | CPU, memory, disk, network and load, reported by an agent on your host |
| Speed | Experience | Full page load timing and Core Web Vitals for one URL |
| Real User | Experience | Load timings collected from your actual visitors' browsers |
| SSL | Domain & Trust | Certificate validity, chain and expiry for one host |
| Domain | Domain & Trust | Registration expiry, registrar and nameservers from WHOIS |
| DNS | Domain & Trust | One zone at its authoritative nameservers, plus record changes |
| Virus | Domain & Trust | Malware and phishing verdicts for one URL |
| Blacklist | Domain & Trust | Your domain and sending IPs across 17 spam blacklists |
Note: Server is the one type that can be missing from your sidebar. It renders only for accounts whose plan grants server monitoring, so an absent Server row means your plan does not include it. Every other type shows for every account.
Availability Checks
Uptime
Use this when you want to know whether a site or service is reachable. An uptime monitor checks one endpoint from the probe locations you pick and opens an incident when the checks fail.
The What should we check? control in the editor splits into three sub-tabs:
| Sub-tab | What it covers |
|---|---|
| Web | HTTP and HTTPS |
| SMTP, POP3 and IMAP mail-server connections | |
| Network | TCP port, Ping (ICMP), DNS resolution and UDP |
All three sub-tabs create uptime monitors, drawn from the same uptime pool. Uptime is the right first monitor for most websites. Read Uptime Monitoring.
Transaction
Use this when one request cannot prove the thing works: a login, a checkout, a search that has to return results. A transaction monitor replays a scripted journey in a real browser, using an 18-action catalog grouped as Navigate, Interact and Verify, and the check fails when a step cannot complete or an assertion does not hold. Read Transaction Monitoring.
API
Use this when you need to exercise an API the way a client does. One API monitor runs an ordered chain of 1 to 15 HTTP requests, each with its own method, headers, body and assertions, and you can pull a value out of one response and reuse it in the next request as {{variables}}. Read API Monitoring.
Heartbeat
Use this for work that runs on your side: a cron job, a queue worker, a nightly backup, a device in the field. There is no URL for Uptimia to call. This is the one family where the ping travels inbound. Your job calls the unique ping URL Uptimia gives it, and Uptimia opens an incident when the expected ping does not arrive within the grace period. A monitor can expect a ping on a fixed interval or on a 5-field cron expression. On top of the ping itself, a job can send a Start or a Fail signal, so a hang or a self-reported failure is caught too. A heartbeat monitor arms itself on its first real ping, so it cannot alert before you have wired it up. Read Heartbeat Monitoring.
Server
Use this when you want the numbers from inside the machine rather than from outside it. A lightweight agent runs on your host and posts CPU, memory, disk, network and load, on a report interval fixed to one of four values: 30 or 60 seconds, 2 minutes or 5 minutes, defaulting to 30 seconds. Alert rules fire on thresholds you set, and silence lasting more than three report intervals opens an offline incident. The incident opens on the next sweep. Read Server Monitoring, and Installing the Uptimia Server Agent for the install.
Experience Checks
Speed
Use this when you care how long a page takes to finish loading. A speed monitor loads the whole page in headless Chrome from your selected locations. It records the total load time, a breakdown by resource content-type, and an own-domain versus third-party split. The same run yields lab Core Web Vitals (LCP, FCP, TTFB and CLS), and you can set per-metric vitals budgets and dead-element alerts, both of which raise Degraded rather than Down. INP is absent because it needs a real visitor interacting with the page. Read Speed Monitoring.
Real User
Use this when you want the numbers from your visitors' own browsers rather than a lab measurement. You add a JavaScript snippet to your pages, and it feeds Real User Monitoring. There are no checks and no check frequency; data arrives as people browse. Uptimia counts pageviews per month instead of checks. Because there are no checks, Real User is the one family with no rows on the Logs page, and the one family left out of the account's fleet availability average. Read Real User Monitoring (RUM).
Domain & Trust Checks
SSL
Use this to stop a certificate expiring without anyone noticing. An SSL monitor tracks validity, the chain and the expiry date for one host, and warns you a chosen number of days ahead. Read SSL Monitoring.
Domain
Use this to protect the registration itself. A domain monitor reads WHOIS for one domain and reports registration status, expiry date, registrar and nameservers, refreshed on a cadence you set. Read Domain Monitoring.
DNS
Use this to watch the zone itself. A DNS monitor queries your zone at its authoritative nameservers rather than at a cache. Each sweep reports two things:
- Per-nameserver health: reachability over UDP and TCP, answer time, whether the server says the answer is authoritative, SOA serial agreement across servers, and whether a server answers recursive queries it should refuse.
- Record changes, measured against a baseline you keep.
Sweeps run every 5 minutes and the cadence is not adjustable. Read DNS Monitoring.
Virus
Use this to find out when browsers start warning people away from your site. A virus check is one Google Web Risk lookup for the URL, covering malware, social engineering and unwanted software, and Uptimia runs it on its own servers rather than from a probe, so there are no per-location results to read. Read Virus and Malware Monitoring.
Blacklist
Use this when your mail has to arrive. A blacklist monitor sweeps 17 DNSBL spam blacklists in three impact tiers. Each sweep covers:
- your domain
- the IP behind its A record
- the IP behind its lowest-priority MX record
- up to five dedicated sending IPs you add
This is a different thing from virus monitoring: browsers flag a site, and mail servers reject a sender. Read Blacklist Monitoring.
Every Family Draws on Its Own Plan Pool
Mixing types is normal. An uptime monitor, an SSL monitor and a speed monitor on one site is a common setup, but each family is counted against its own per-plan allowance, so "mix and match" has a ceiling. On Free the only non-zero pools are 1 uptime monitor and 1 API monitor; every other family is 0 on that plan. Speed and Transaction share a single Advanced checks pool rather than one each, so you split that allowance between them however you like. The full per-plan table is in Plan Limits and Quotas.
Settings That Apply Across Monitor Types
| Topic | What it does |
|---|---|
| Outage confirmation | How many confirming checks a failure needs before an incident opens: 1 to 3, default 3. It lives on the editor's Advanced tab, under Outage confirmation. Offered on seven families: Uptime, SSL, Speed, Domain, Transaction, API and DNS |
| Monitoring locations | Which probes run your checks, and the 6-probe floor on a custom selection |
| Location profiles | A saved probe set reused across monitors, editable in one place |
| Monitor groups | Grouping monitors for filtering, reports and team scoping |
| Monitor templates | Saved editor settings applied to new monitors |
| Monitor notes | A short runbook note that travels to the incident page, the alert email and the webhook |
| Escalation policies | A tiered ladder that pages one group, waits, then pages the next |
| Alert grouping | Collapsing a storm of related incidents into one digest |
| Maintenance windows | Suppressing checks and alerts during planned work |
| Monitor statuses | What Up, Degraded, Down, Paused and Suspended mean on a monitor row |
Allowlisting the probe addresses in a firewall, WAF or CDN applies to every family Uptimia checks from the outside. See Whitelisting Uptimia's Probe IPs.