
A maintenance window is a scheduled period when Uptimia mutes alerting for the monitors you name and stops checking them. It runs once or repeats, and it can post a notice on your status pages. Maintenance seconds leave your availability math. If a monitor is in maintenance and you do not know which window put it there, start at Why a Monitor Stopped Checking.
Before You Start
- Owner, Admin and Editor seats can schedule maintenance. Read-only and Accounting / Billing seats cannot.
- Maintenance windows are available on every plan.
- Every time on this page, typed or displayed, is wall clock in your account time zone. The page header shows that zone as a chip.
What a Running Window Does
While a window is running, Uptimia mutes alerts for the covered monitors and pauses their checks. Each covered monitor is flagged within a minute of the start, and its next check moves to the end of the occurrence. A check already in flight when the flag lands is thrown away on arrival. It writes no log row, opens no incident and fires no alert.
| Effect | What happens |
|---|---|
| Checks | Paused. No probe runs, and no check log rows are written while the window lasts. |
| Alerts | Muted for every covered monitor, on every channel. |
| Open incidents | Force-closed the moment the monitor is flagged. |
| Queued down alerts | A queued down alert that has not reached its send time is canceled. One already past its send time still delivers. |
| History before the window | Untouched. Nothing already recorded is deleted or rewritten. |
| Availability | Maintenance seconds leave both the numerator and the denominator, so the window counts as neither downtime nor uptime. |
| Public status pages | A covered monitor renders a Maintenance component state, which outranks down and degraded. |
Expect a gap in the Check log card for the length of the window. That gap is the window working, not data loss. Private charts, scheduled reports and the 90-day availability ribbon on a public status page all follow this rule. The one exception is the uptime percentage printed beside each component on a status page: it divides by a fixed 90-day window, so maintenance seconds stay in its denominator. See How Uptime Is Calculated.
Note: If Uptimia misses the start of a one-time window, it applies that window retroactively only within 1 hour of the end. An older miss is closed out with no side effects.
Recovery Alerts You Are Still Owed
Say a monitor was already down before the window and gets fixed during it. Its recovery alert waits. It goes out on the first real up check after the window ends. If a fresh outage arrives after the window instead, that outage gets its own down and recovery alerts, and the owed one is dropped, so you never see a phantom double recovery.
This covers every family except Server, Real User and DNS. Server and Real User monitors recover on their own model instead, and a DNS monitor does not send the owed alert at all, so check a DNS monitor by hand after a window if it was already down going in. Every other family delivers it on its next good result.
| Family | Delivers the owed alert on |
|---|---|
| Probe families | The first passing check |
| Heartbeat | The first success ping |
| API and blacklist | The first passing run or clean sweep |
Creating a Maintenance Window
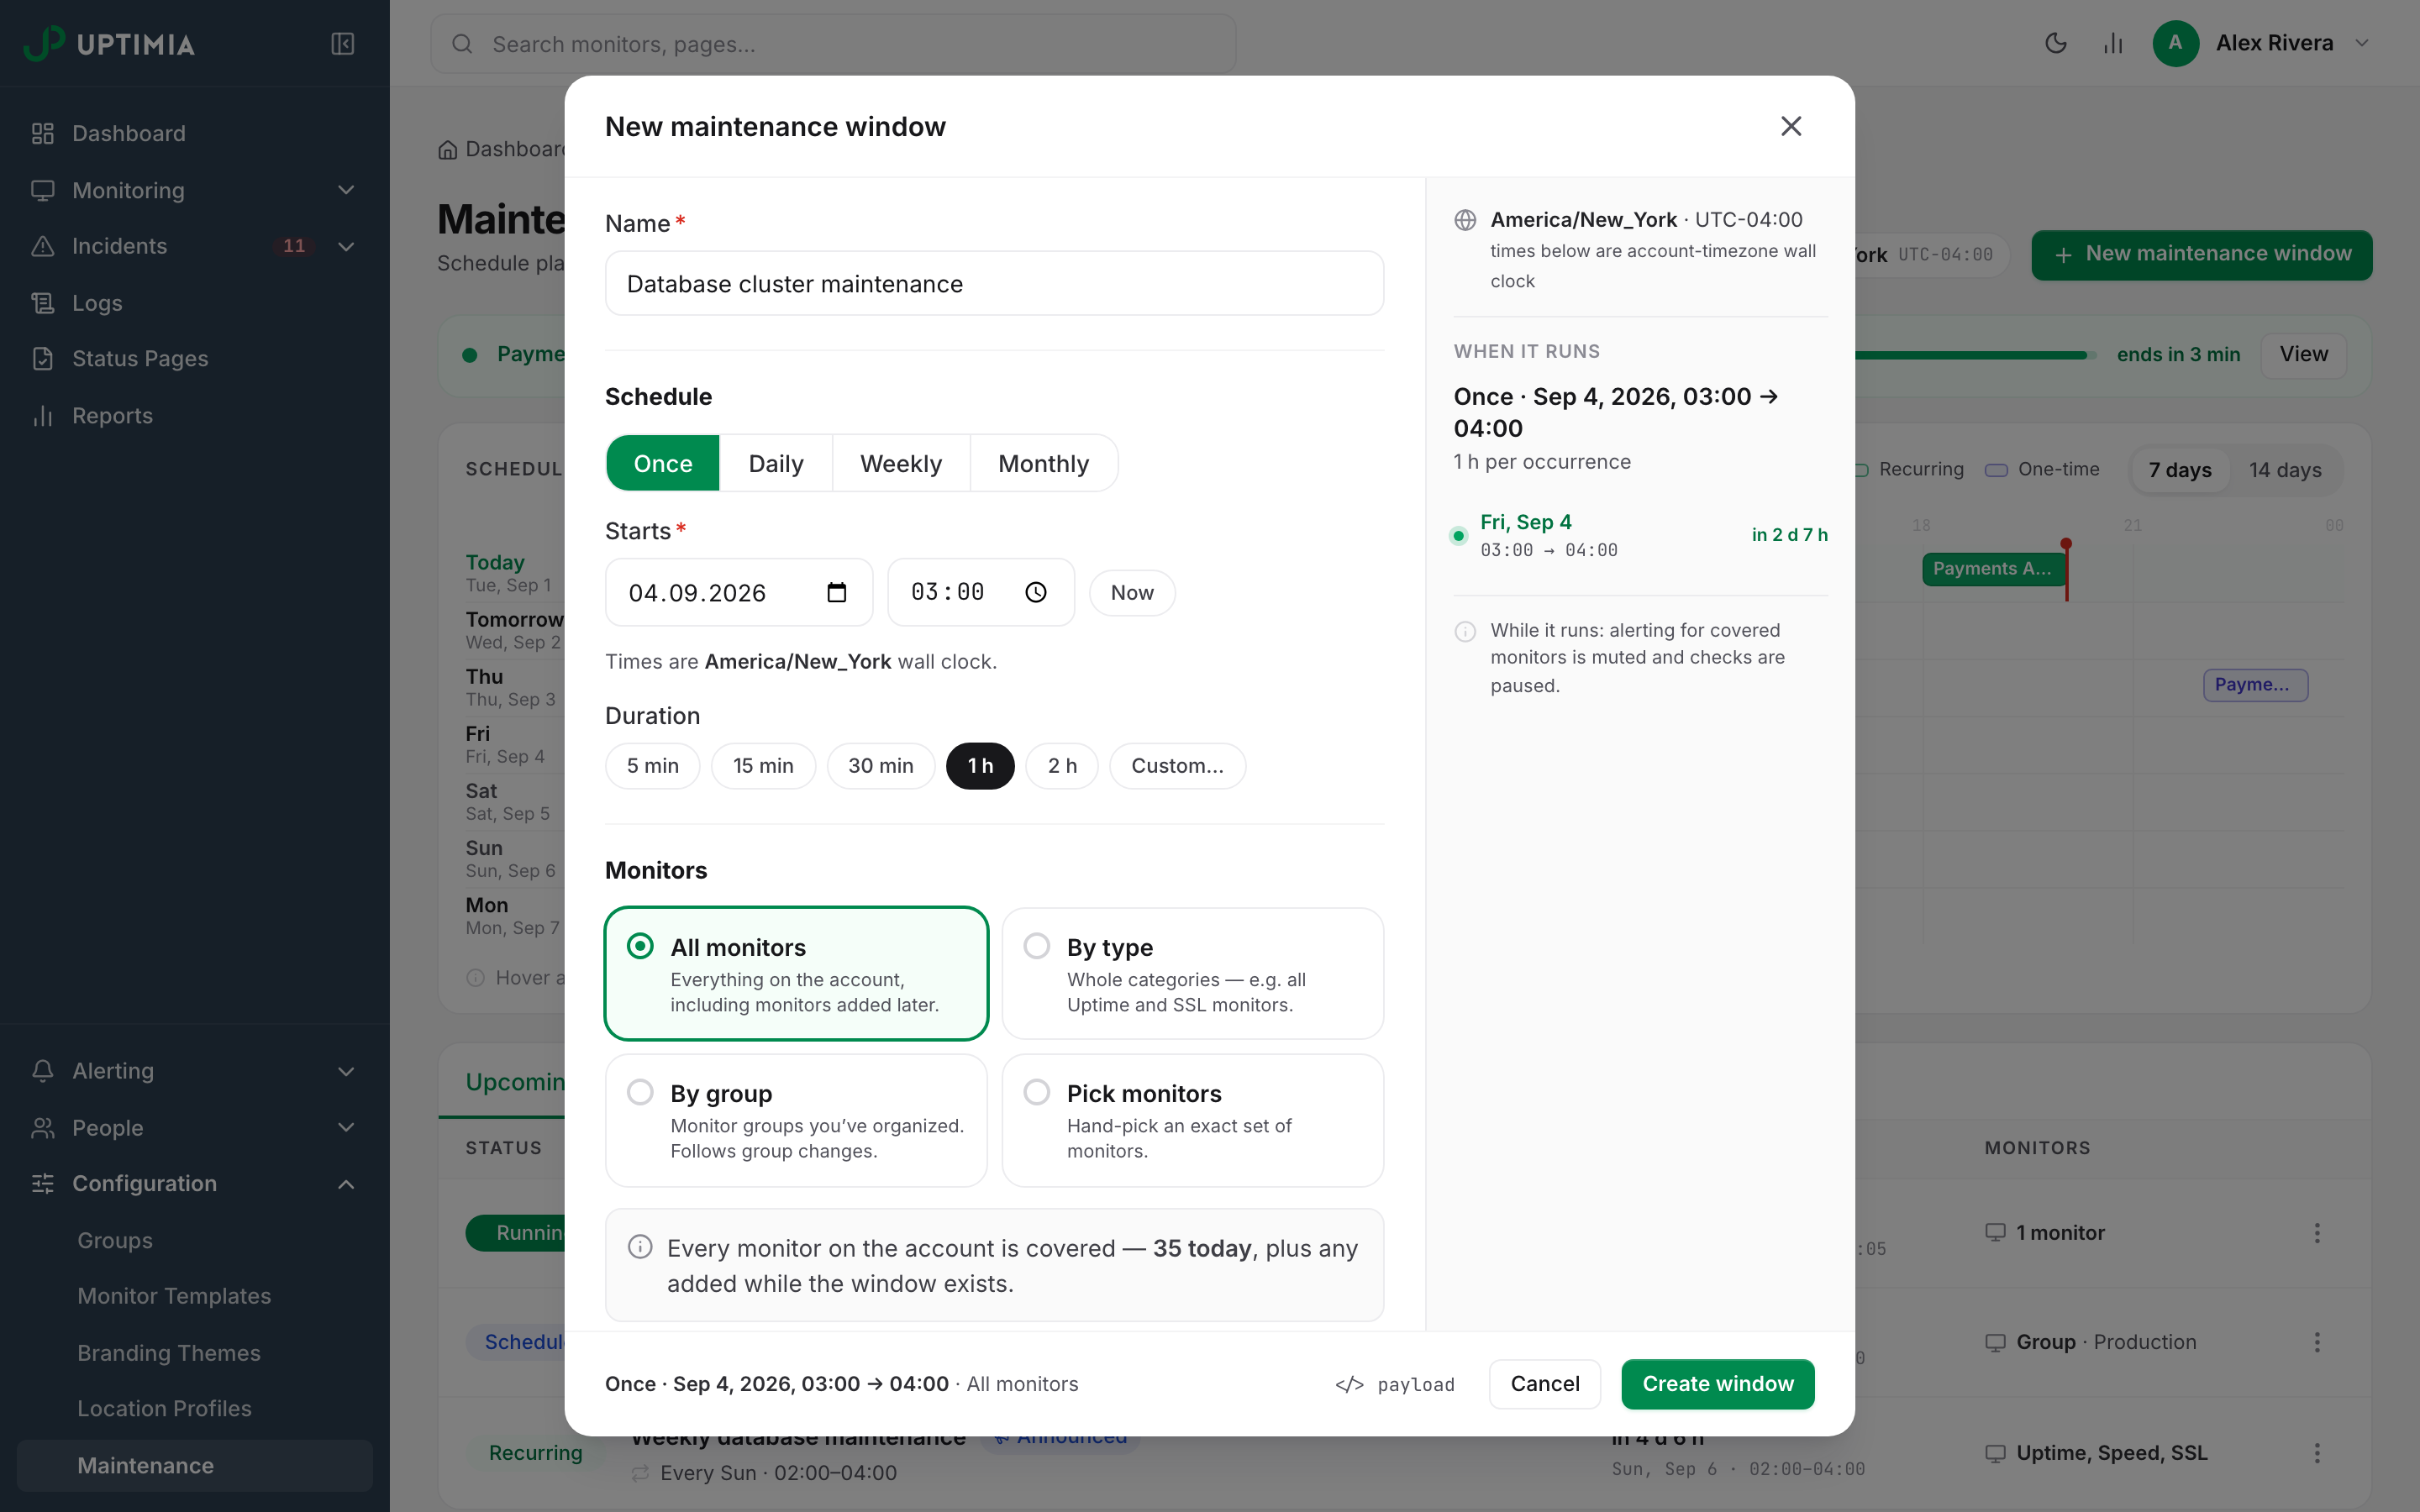
- Go to Configuration → Maintenance.
- Click New maintenance window.
- Enter a Name.
- Under Schedule, pick how often the window repeats: Once, Daily, Weekly or Monthly.
- Set the start time and duration. The Now chip seeds the start from your account's wall clock.
- Choose the affected monitors with one of the four mode cards.
- Set Announce on status pages if the window should appear publicly, and write the announcement.
- Check the right rail, then click Create window.
The right rail is a live preview. It lists the next 5 occurrences and names any window the draft overlaps. A </> payload toggle in the modal's footer bar shows the same settings written out for a script, which you can ignore unless you also create windows from a deploy pipeline.
Frequency and Schedule Fields
| Field | What it does | Default | Limits |
|---|---|---|---|
| Name | Names the window in the list, and titles the public notice if you announce it. | — | Required, up to 120 characters; 5 or more to announce |
| Once / Daily / Weekly / Monthly | The repeat buttons under Schedule. | Once | — |
| Duration chips | Set the end from the start. Rendered as 5 min, 15 min, 30 min, 1 h, 2 h and Custom…. | 1 h | — |
| +1 day | Marks a window whose end falls after midnight. Uptimia turns it on for you when the end time is at or before the start time. | Off | — |
| On days (Weekly) | The weekdays the window runs on. | — | At least 1, Monday–Sunday |
| Only specific weeks of the month (Weekly) | Restricts the window to the 1st–5th occurrence of that weekday in the month. | Off | 1–5 |
| Days of the month (Monthly) | The dates the window runs on. | — | At least 1, in the range 1–31 |
A window is end-exclusive. 09:00–10:00 covers 60 minutes, not 61. A window may run longer than 24 hours, and the modal marks that with a warning chip instead of blocking it. One-time window times are typed and read back in your account time zone, so create, view, edit and save all show the same times, even from a browser in another time zone.
Choosing the Affected Monitors
| Mode card | What it covers |
|---|---|
| All monitors | Every monitor on the account, including any created while the window exists. |
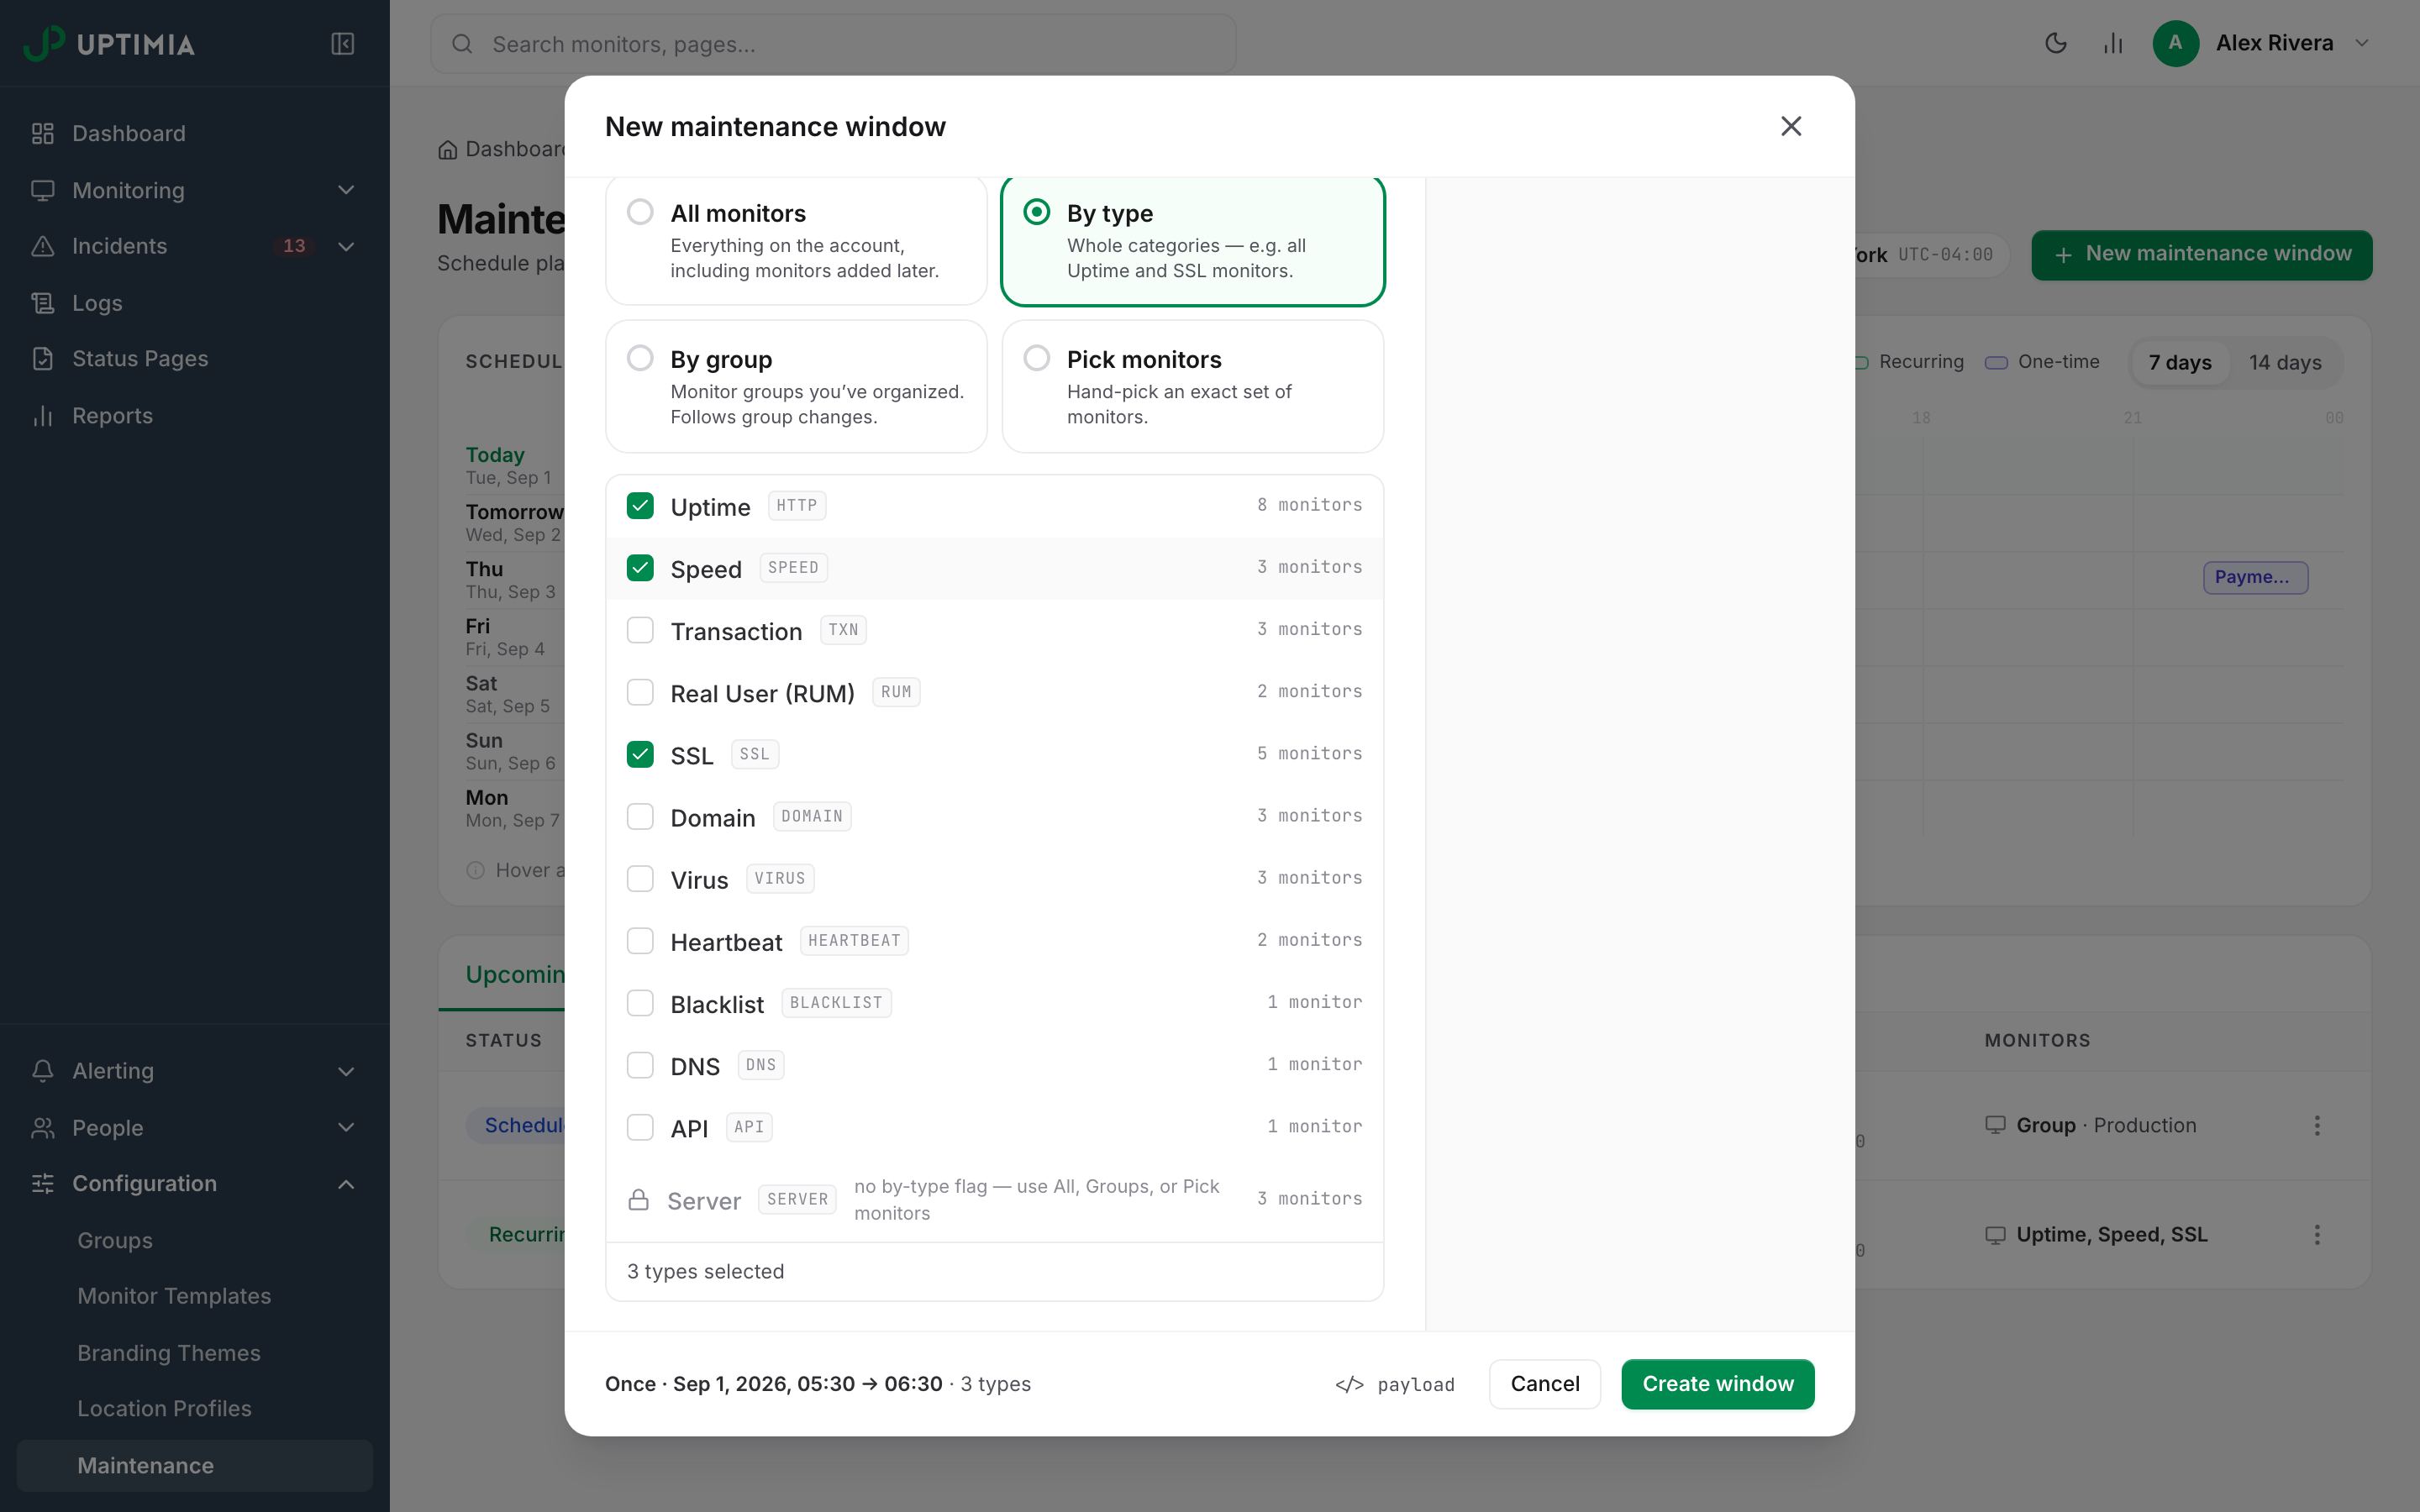
| By type | Whole families. Eleven of the twelve are selectable here. |
| By group | One or more monitor groups. Membership is followed, so a monitor added to the group later is covered. |
| Pick monitors | A hand-picked set, from a searchable list grouped by type. |
By type carries Uptime, Speed, Transaction, Real User (RUM), SSL, Domain, Virus, Heartbeat, Blacklist, DNS and API. Server appears as a disabled row reading no by-type flag — use All, Groups, or Pick monitors. Cover server monitors with All monitors, a group that contains them, or Pick monitors. For the families each publishing surface accepts, see Monitor Type Coverage.
Announcing on Status Pages
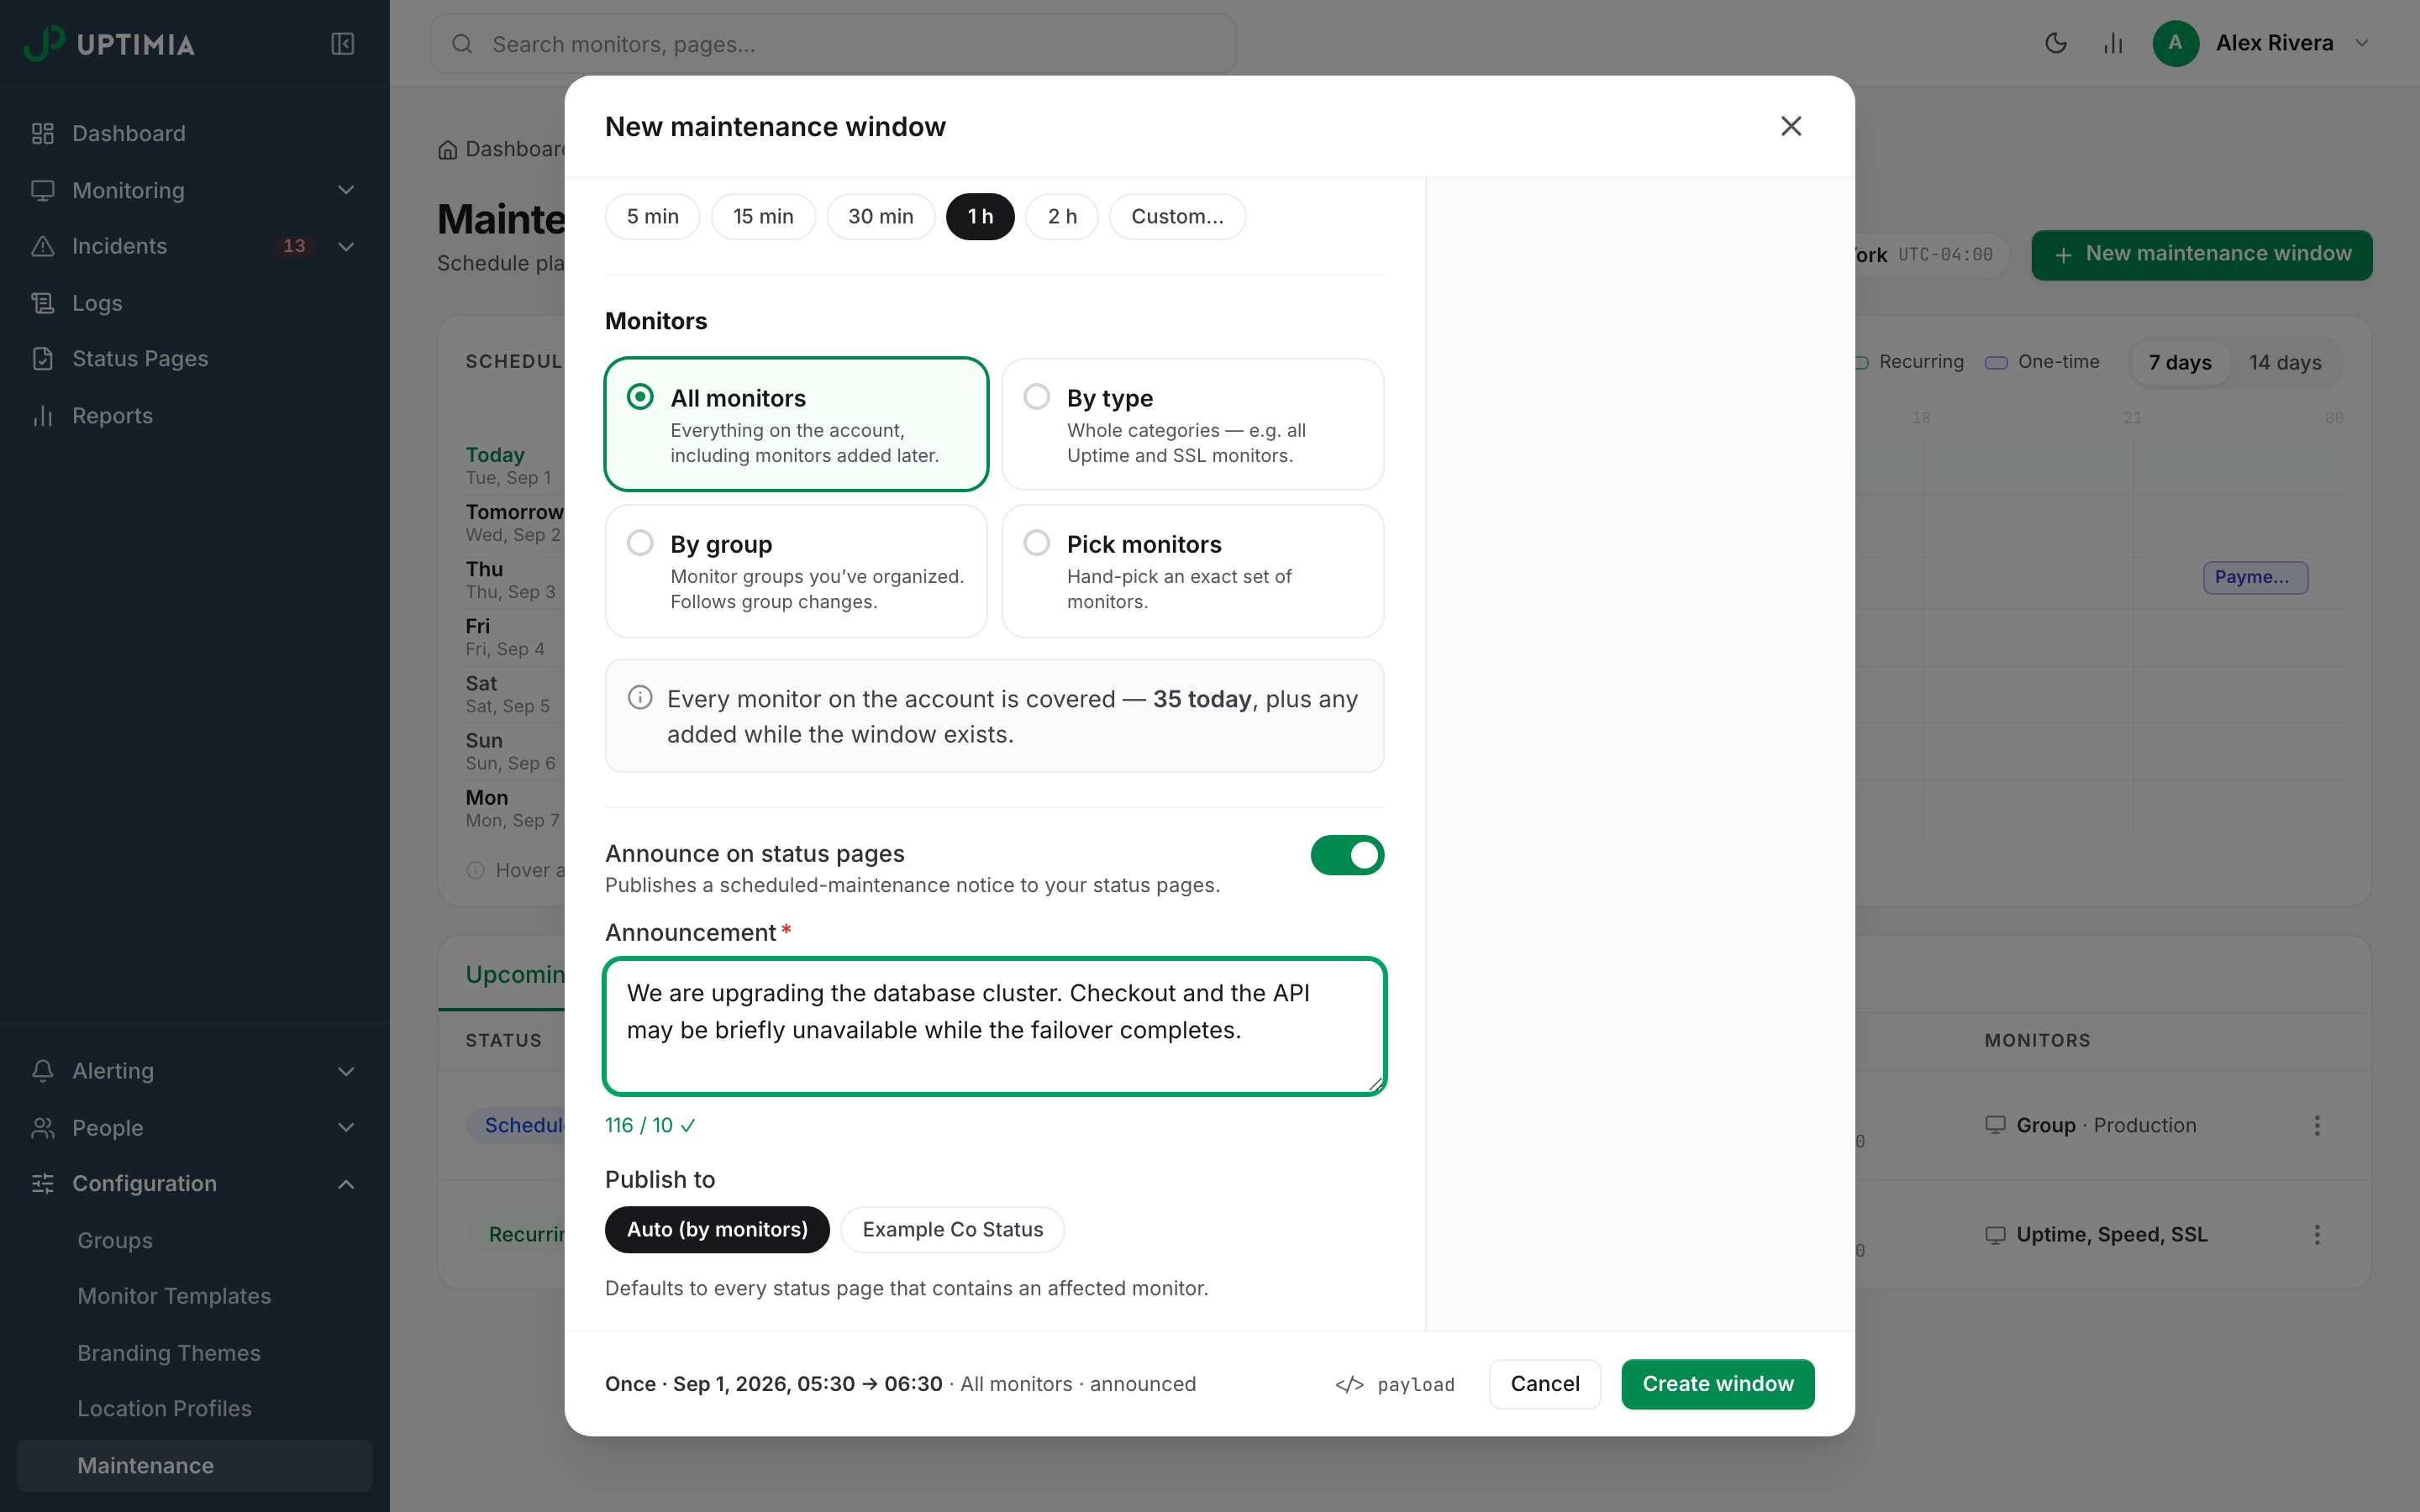
Announce on status pages publishes a public maintenance notice, at any frequency. Uptimia announces the next occurrence of a recurring window and rolls the notice forward after each one ends. Uptimia emails subscribers once, when the notice is first published.
The toggle is disabled only when the window's scope provably contains no monitor a status page can show. Status pages render uptime, SSL and Speed monitors. Scope a window to other families, by type or by hand-picked monitors, and the toggle explains why it is off:
Status pages only show uptime, SSL and speed monitors — this window covers none, so it can't be announced.
All monitors and By group scopes always keep the toggle available, because the modal cannot resolve their membership up front.
Turning it on adds two length rules. The Name needs 5 characters or more, and the Announcement needs 10 or more. Fall short on either and the editor blocks the save. The Publish to chips decide where the notice lands: Auto (by monitors) targets every status page containing an affected monitor, or you can pick specific pages.
Reading the Maintenance Page
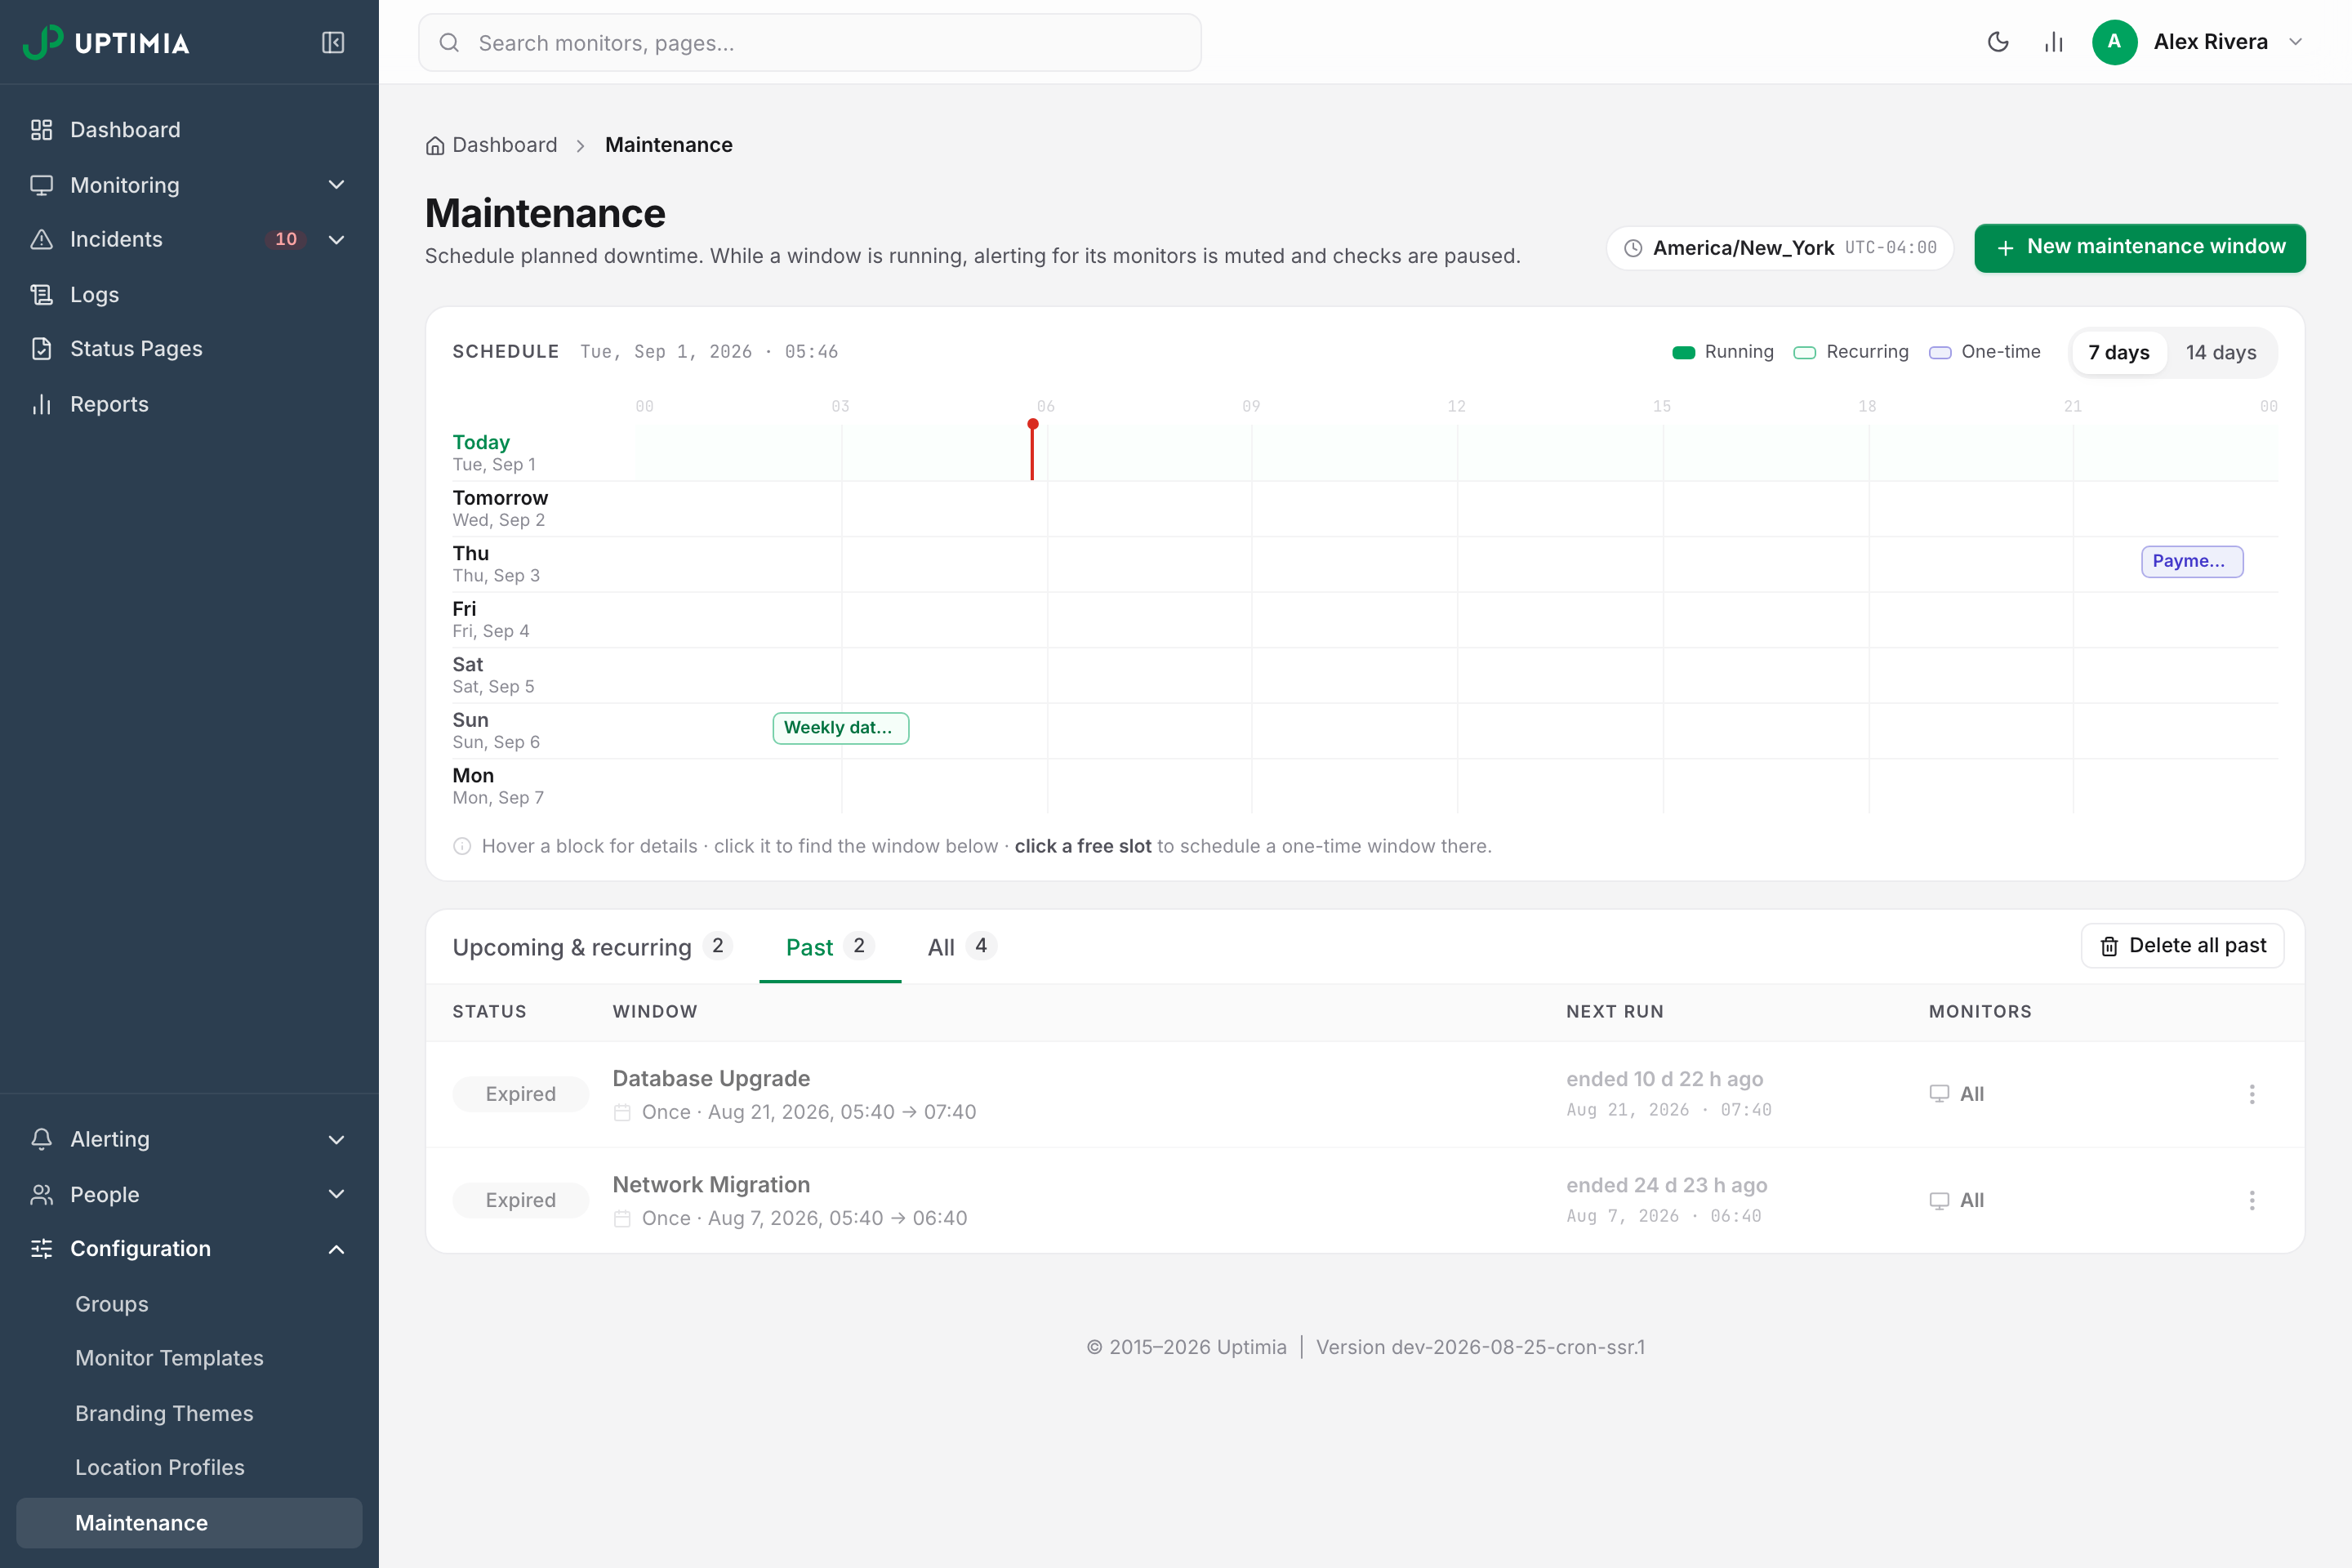
Three things stack on Configuration → Maintenance, in this order.
Running-now strips sit at the top, one per running window. Each carries a pulsing dot, the window's name and scope, a progress bar, a live ends in … countdown, and a View button that scrolls to the row and flashes it. The strip also notes that monitors you ended early are alerting again.
The schedule timeline shows every occurrence over the next 7 days or 14 days, one row per day. Overlaps stack into lanes. A cross-midnight window splits into two blocks with dashed cut edges. Past occurrences are dimmed, and today carries a now-line. Click a free slot to open the create modal prefilled with that day and time, snapped to the hour or half hour.
The window list sits under three tabs: Upcoming & recurring, Past and All. Its columns are Status, Window, Next run and Monitors. Window writes the schedule out in words ("Every Sun · 02:00–04:00", "Monthly · 1st & 15th") and adds an Announced badge. Next run shows a relative time above the absolute time in your account time zone, and counts down live while a window runs.
Status Values
| Status | What it means | What to do |
|---|---|---|
| Running | An occurrence is live right now | Nothing. Use End Maintenance if the work finished early |
| Recurring | A repeating window, not running right now | Nothing. Check Next run for the next occurrence |
| Scheduled | A one-time window whose start is still in the future | Editable in full until it starts |
| Expired | A one-time window that has ended | Delete it, or clear the tab with Delete all past |
| Invalid | A legacy recurring row whose time range can never fire; it reads "Never runs — invalid time range; edit to fix" | Open it and set an end after the start, or use +1 day |
Ending Maintenance Early
Use End Maintenance from a monitor's action menu, from the dashboard row menu, or from the dashboard's bulk bar after selecting monitors. Alerting and checks resume right away for the monitors you picked.
For a recurring window this suppresses only the occurrence running now. The next occurrence applies normally. So does any other window whose occurrence did not cover the moment you clicked. Ending maintenance also re-anchors a heartbeat monitor's expected next ping, so the sweep opens no bogus missed-ping incident. A window that ends on its own resets the stale clock of a server whose agent stayed silent throughout, so the first tick afterwards raises no false agent-offline alert.
The reverse action, Schedule Maintenance, sits on the same menus and opens the create modal with that monitor preselected. Monitors in a running window carry a maintenance badge on the dashboard, and its Maintenance tile counts them. When nothing is in maintenance, the tile's sub-line counts your scheduled windows instead, so a future one-time window is visible before it starts.
Editing, Duplicating and Deleting
Every row's kebab menu holds Edit, Duplicate, Post status update and Delete, whatever the frequency. Clicking the row opens the editor.
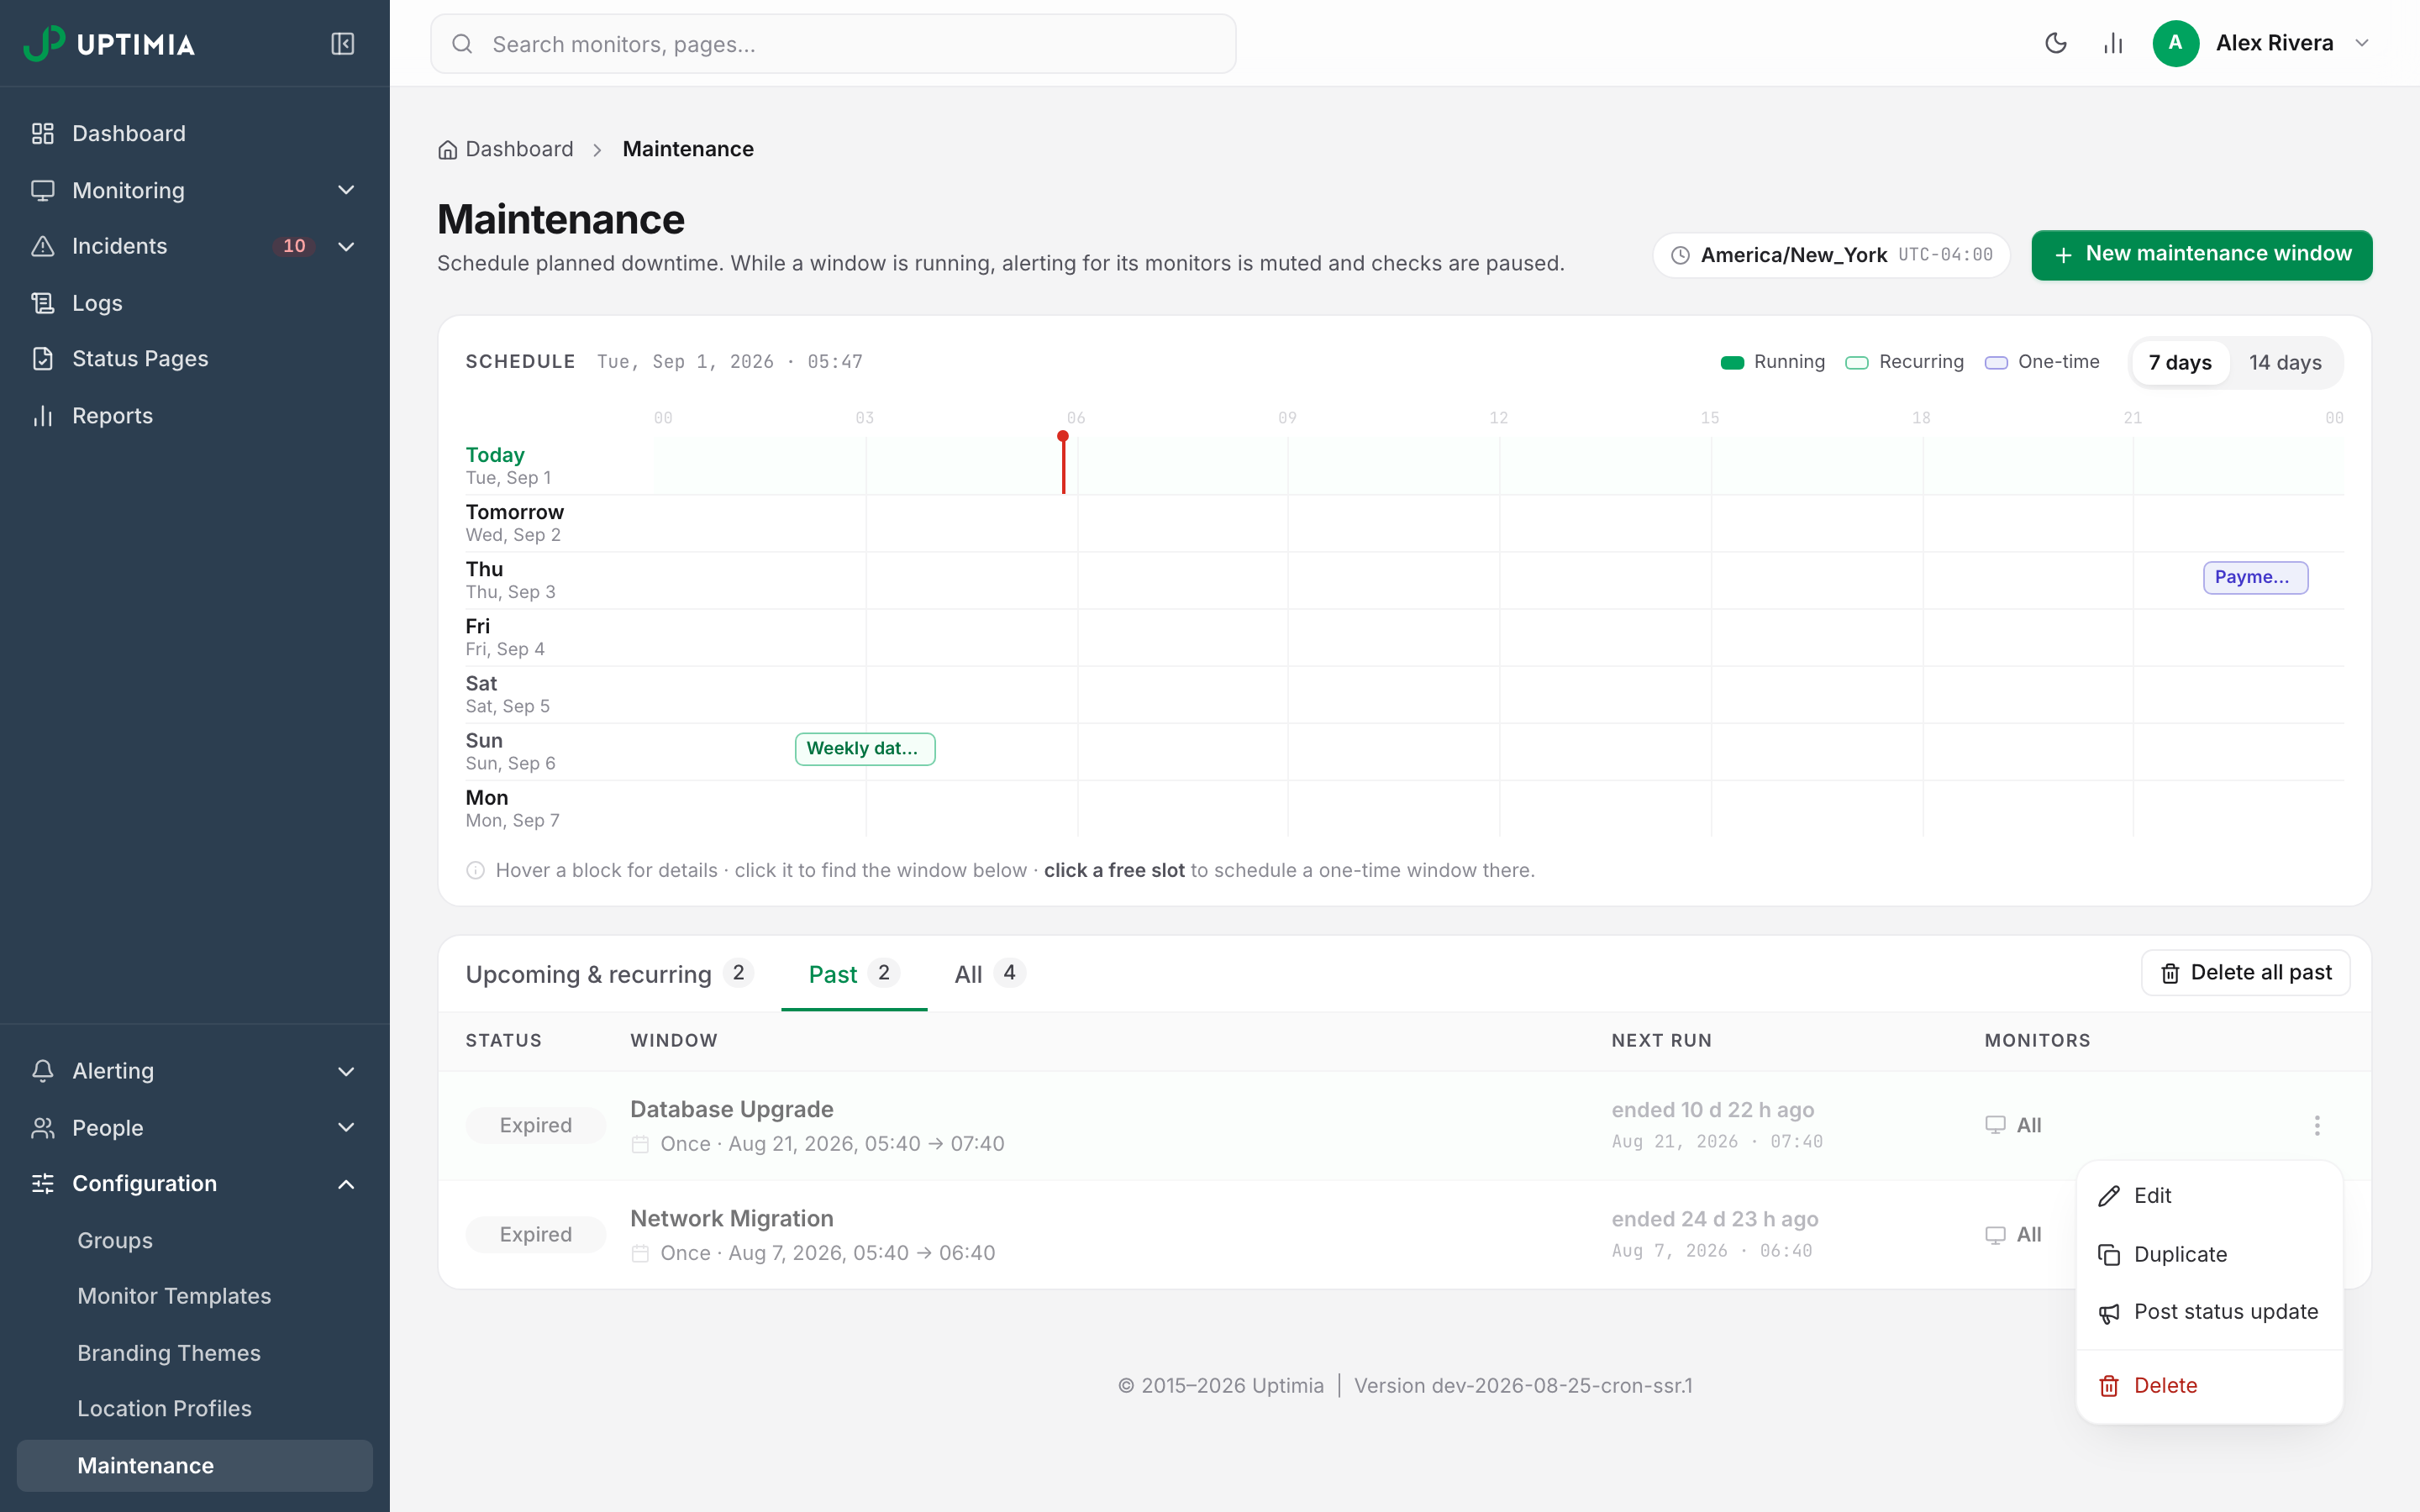
Schedule and monitor fields freeze in two cases only: while a window is running, and after a one-time window has started. A one-time window that has not started yet is fully editable. Change its time or its monitors freely. Rescheduling a window that already announced moves the public notice to the new times. The name and the announcement stay editable in every case.
Duplicate opens a new window prefilled from the original and named "Copy of …", without the announcement. Post status update opens the window's existing public thread, or a new maintenance thread bound to it.
Delete asks for confirmation and states what you lose: a running window warns that its monitors leave maintenance immediately, an announced one that the public notice will be unpublished. There is no undo. Recreating the window starts a new thread and re-emails subscribers. On the Past tab, Delete all past clears every expired one-time window at once. Resolved status-page threads and their updates survive.
Warning: Deleting a monitor group takes that group's monitors out of maintenance immediately. If a window covered them only through that group, they resume checking and alerting on the next tick.
Recurring Schedule Rules
- Monthly, short months. A day past the end of the month runs on the month's last day. That is 29 February in a leap year, 28 otherwise. The 30th and the 31st together produce one February occurrence, not two.
- Weekly, specific weeks. The number counts the Nth occurrence of that weekday in the month, not the ISO week. A fifth occurrence that does not exist in a month is skipped, never spilled into the next one.
- Cross-midnight windows are anchored to the day they start on. A Friday 23:30–01:00 window is a Friday window, and its tail past midnight is suppressed with the rest of it.
- Daylight saving. Times are wall clock. A start inside a spring-forward gap moves forward by the gap, and a repeated fall-back time resolves to the first pass.
- Deleting a monitor removes it from any window that named it individually.
Team Access and Monitor-Group Scoping
An Editor limited to specific monitor groups sees a filtered maintenance page. Read-only and Accounting / Billing seats see no maintenance page at all. A window reaching outside the Editor's groups is hidden, and behaves as if it does not exist. All monitors and By type are refused. Both cover monitors the member cannot see. By group and Pick monitors are narrowed to the Editor's own groups. Delete all past is refused too, because it would sweep up windows covering monitors outside their groups; Owner, Admin and any unscoped Editor can use it.
To drive windows from a deploy pipeline instead of the control panel, see Automating Maintenance from Your Pipeline.