
Uptimia gives you three shapes of export:
- A filtered CSV of a whole list
- A self-contained PDF or HTML document for one incident or one check
- A public link to that same document, which anyone can open without signing in
For recurring emailed summaries, see Scheduled Reports instead.
What You Can Export
| Screen | CSV of the filtered list | One item as a file | Public link |
|---|---|---|---|
| Incidents → History | Export CSV | Download PDF, Download HTML | Create public link |
| Incidents → Active | — | Download PDF, Download HTML | Create public link |
| Logs (Monitoring Logs) | Export CSV · N rows | Download PDF, Download HTML | Create Public Link |
| Reports | — | Export PDF, Export HTML, Export CSV | Create Public Link |
The Active view has no CSV button, because a CSV export needs a date window and Active is a live view. A Live · refreshes every 30 s pill sits in its place.
Exporting Incidents
All 12 monitor families open incidents: Uptime, Transaction, API, Heartbeat, Server, Speed, Real User, SSL, Domain, DNS, Virus and Blacklist. An unfiltered export spans every one of those families except Real User. RUM incidents are included only when you select RUM monitors in the Specific monitors pill.
The Filtered CSV
- Go to Incidents → History.
- Set the date-range picker. For a subset, also set the Specific monitors pill, a checkbox menu grouped by monitor type.
- Click Export CSV.
The date range and the Specific monitors pill are the only filters the file obeys. The search box, the All / Ongoing / Resolved chips and the All types dropdown narrow what you see on screen, not what you download.
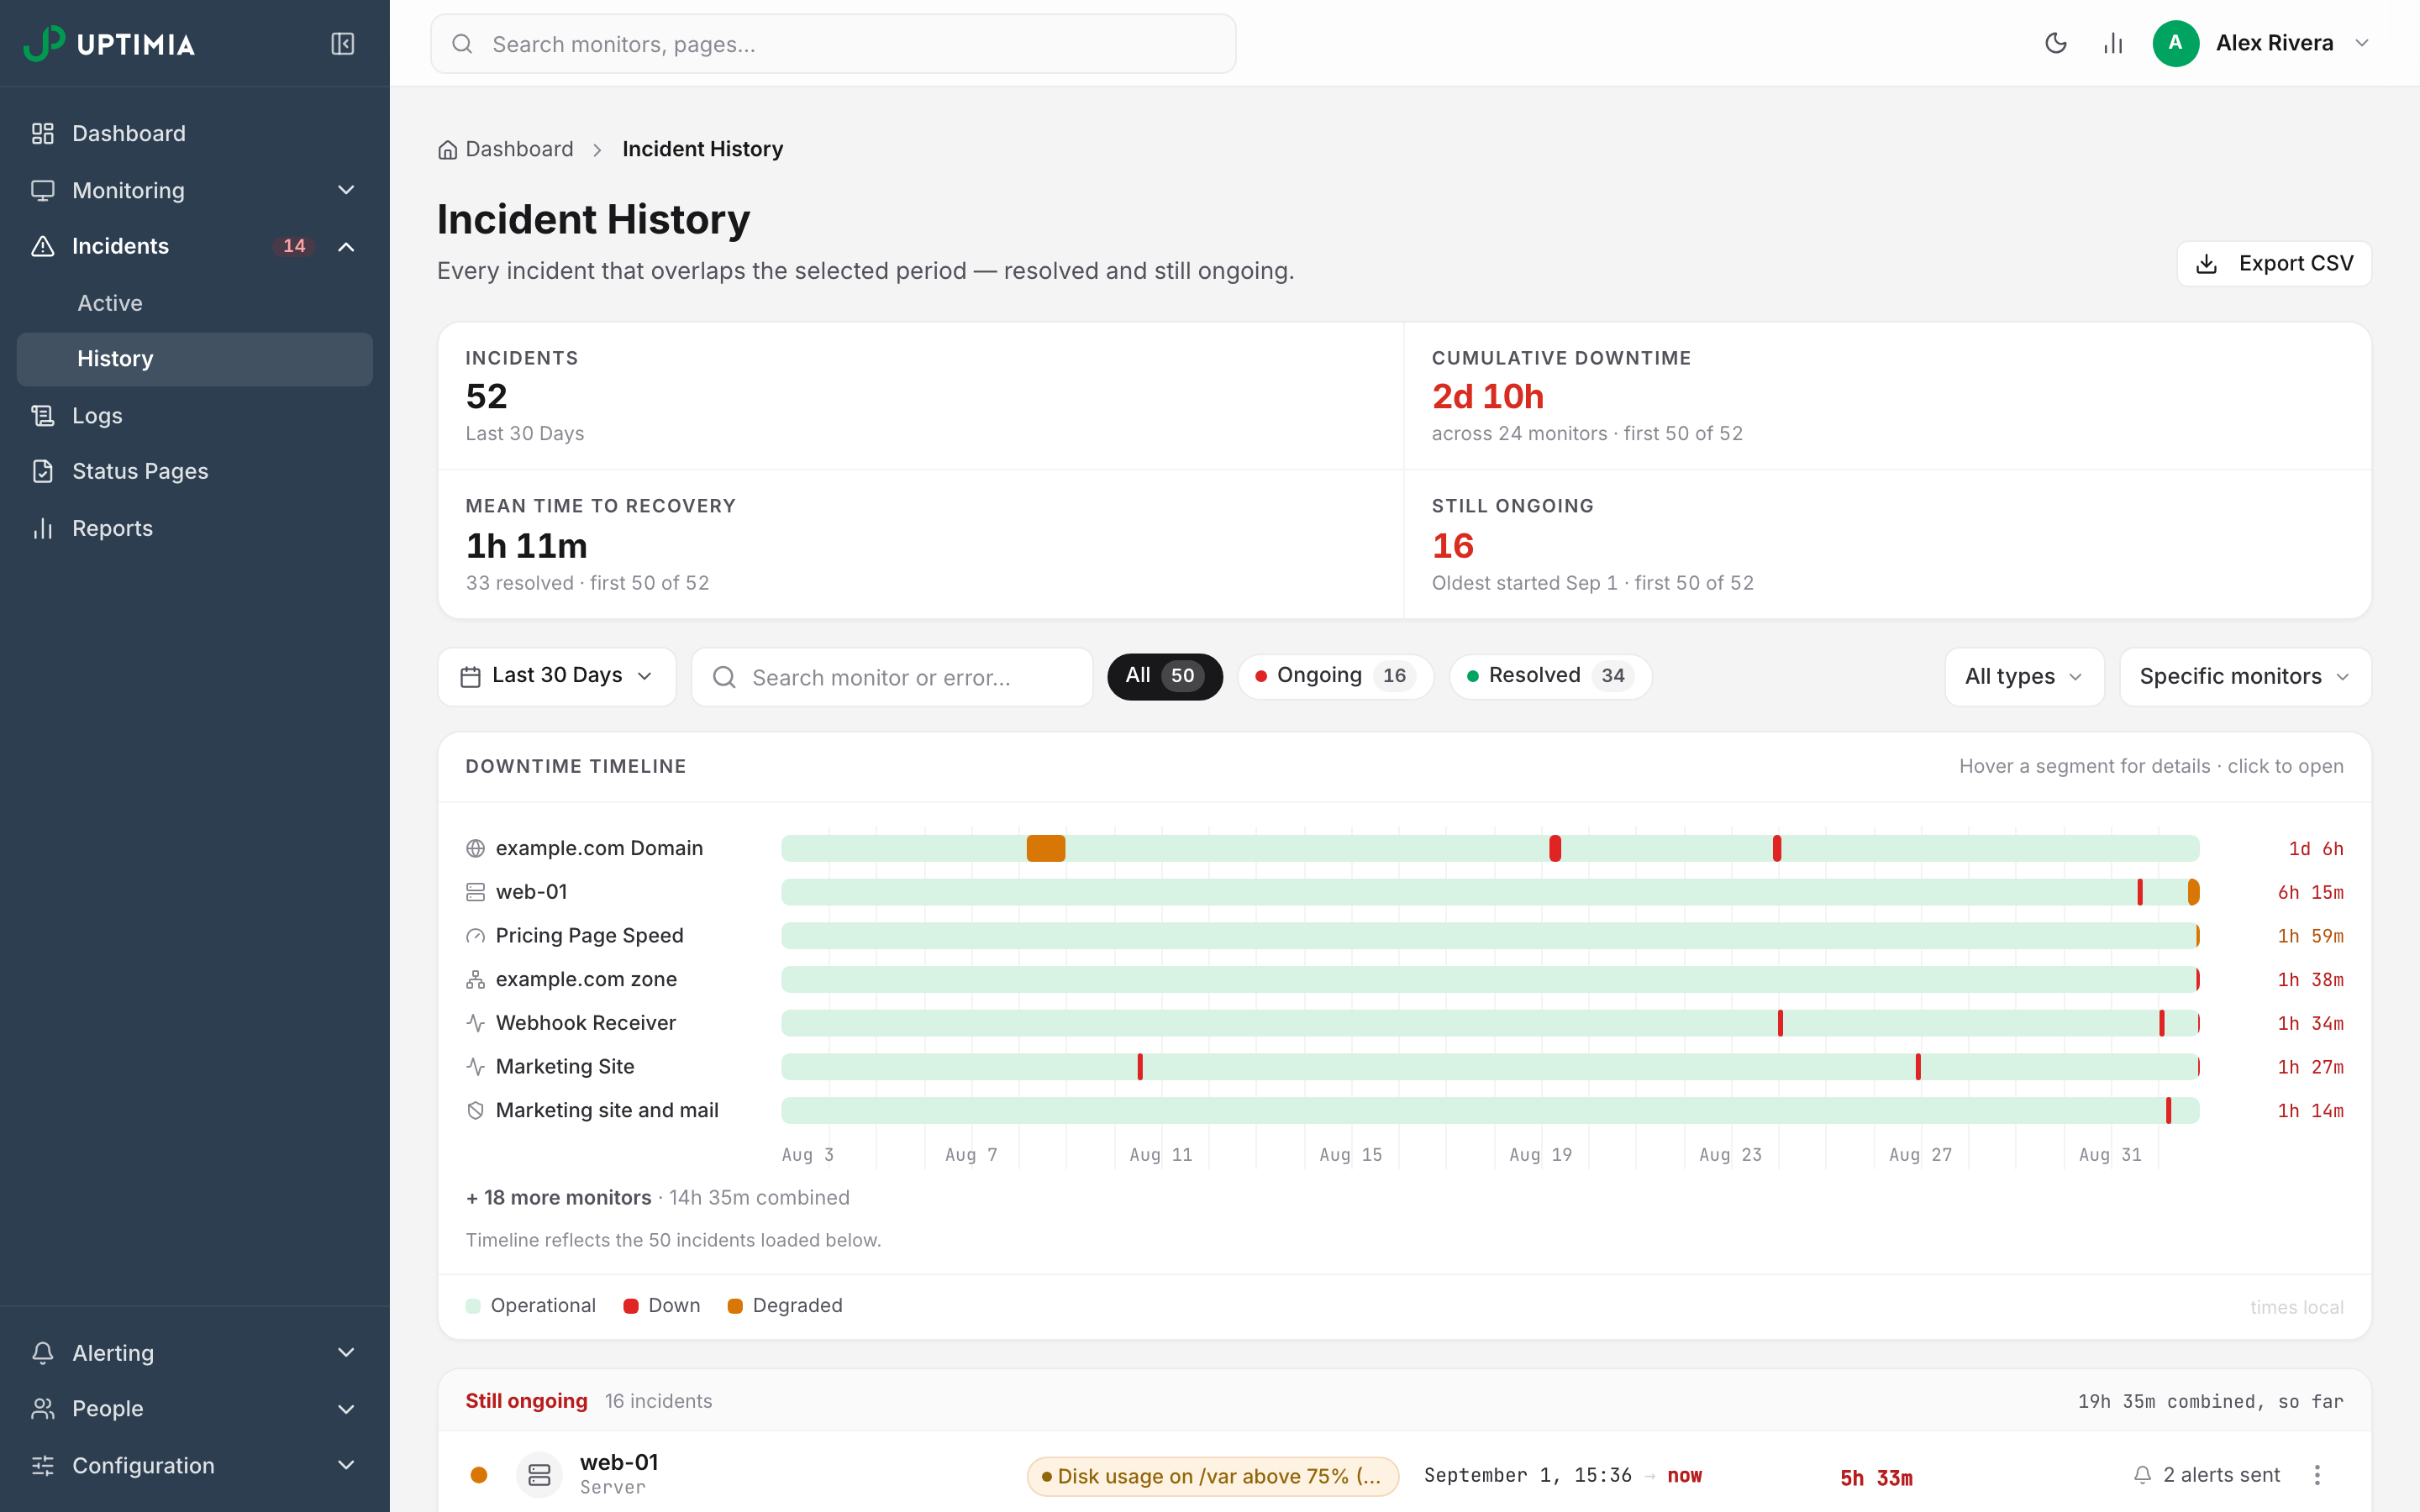
The file is named UptimiaIncidents.csv and carries 7 columns: Name, Type, Alerts sent, Error, Start Time, End Time, Duration. Timestamps render in your account's time zone. A long date range downloads in full.
The file matches the History list, so it leaves out incidents belonging to a currently paused monitor. Pausing hides that monitor's past incidents from the account-wide views and from this file. A member limited to specific monitor groups exports only the monitors in their scope.
One Incident as a Document
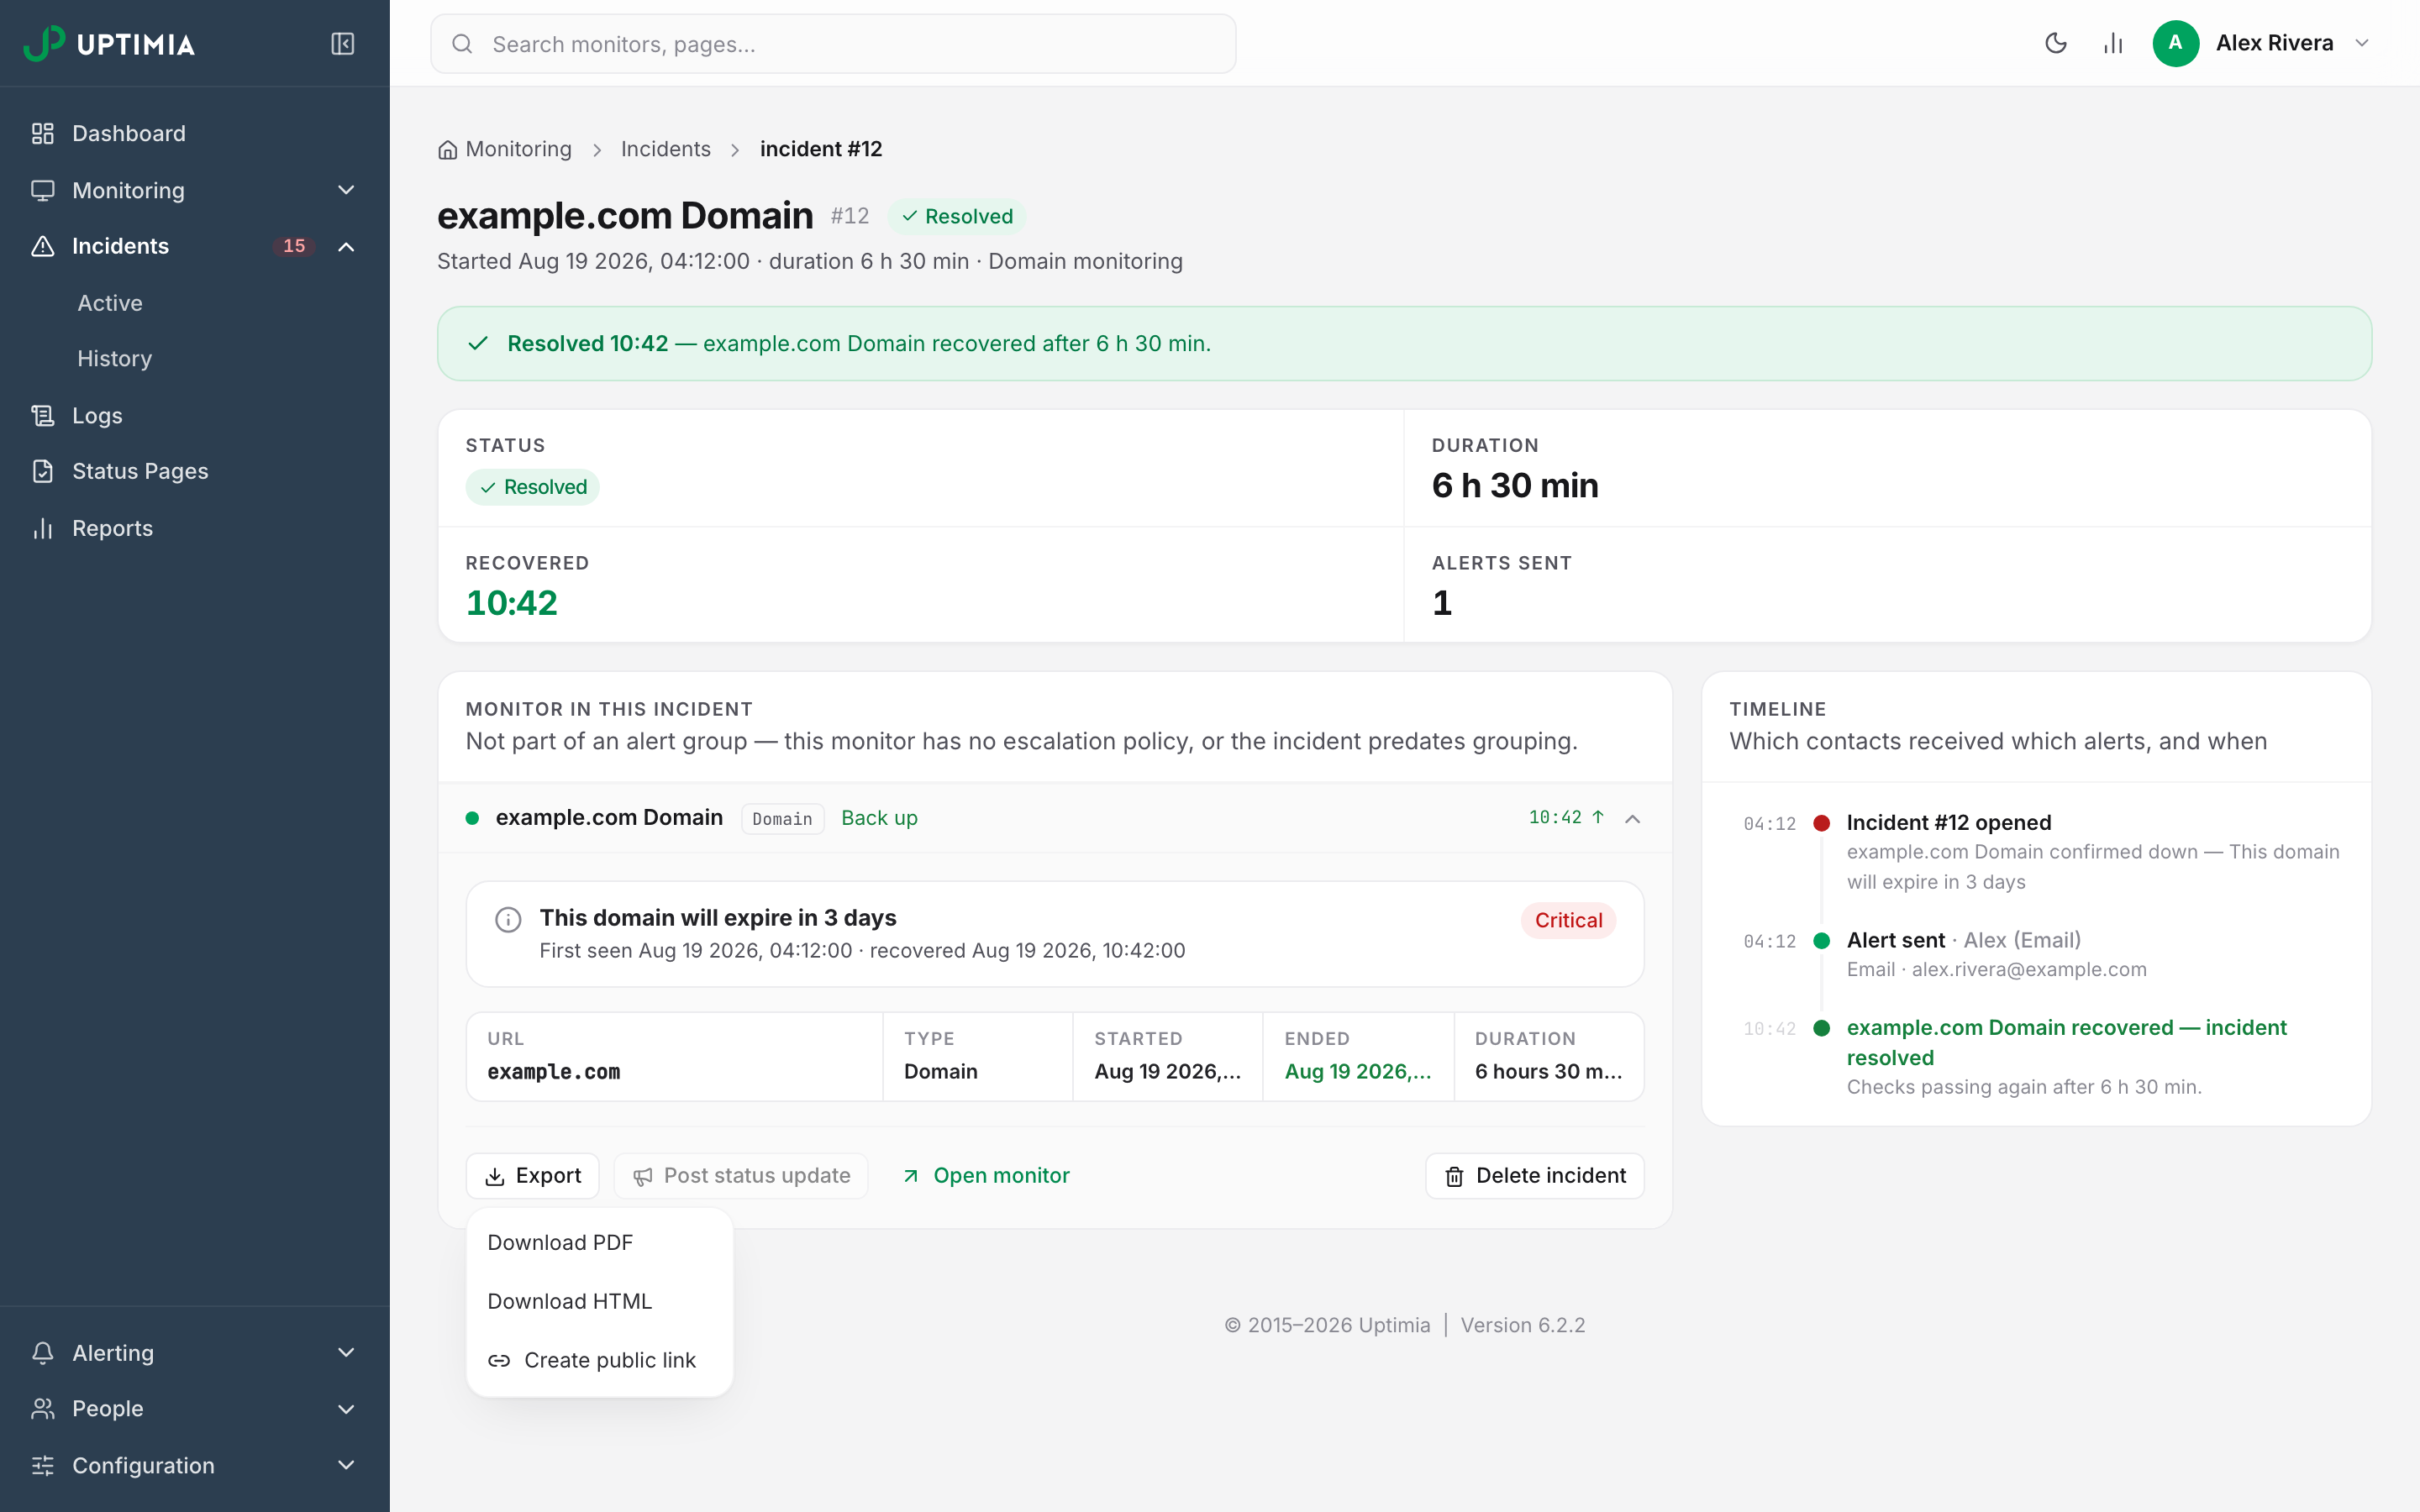
Open an incident from Incidents → History or Incidents → Active to see its full page; a grouped incident opens its group page instead. At the bottom of the root-cause panel is an actions footer with an Export dropdown:
- Download PDF:
Root-Cause-Analysis.pdf - Download HTML:
Root-Cause-Analysis.html - Create public link: publishes the same HTML at a public URL
Create public link appears only for members who can manage monitoring: Owner, Admin and Editor. A Read-only member sees a two-item dropdown.
Exporting Monitoring Logs
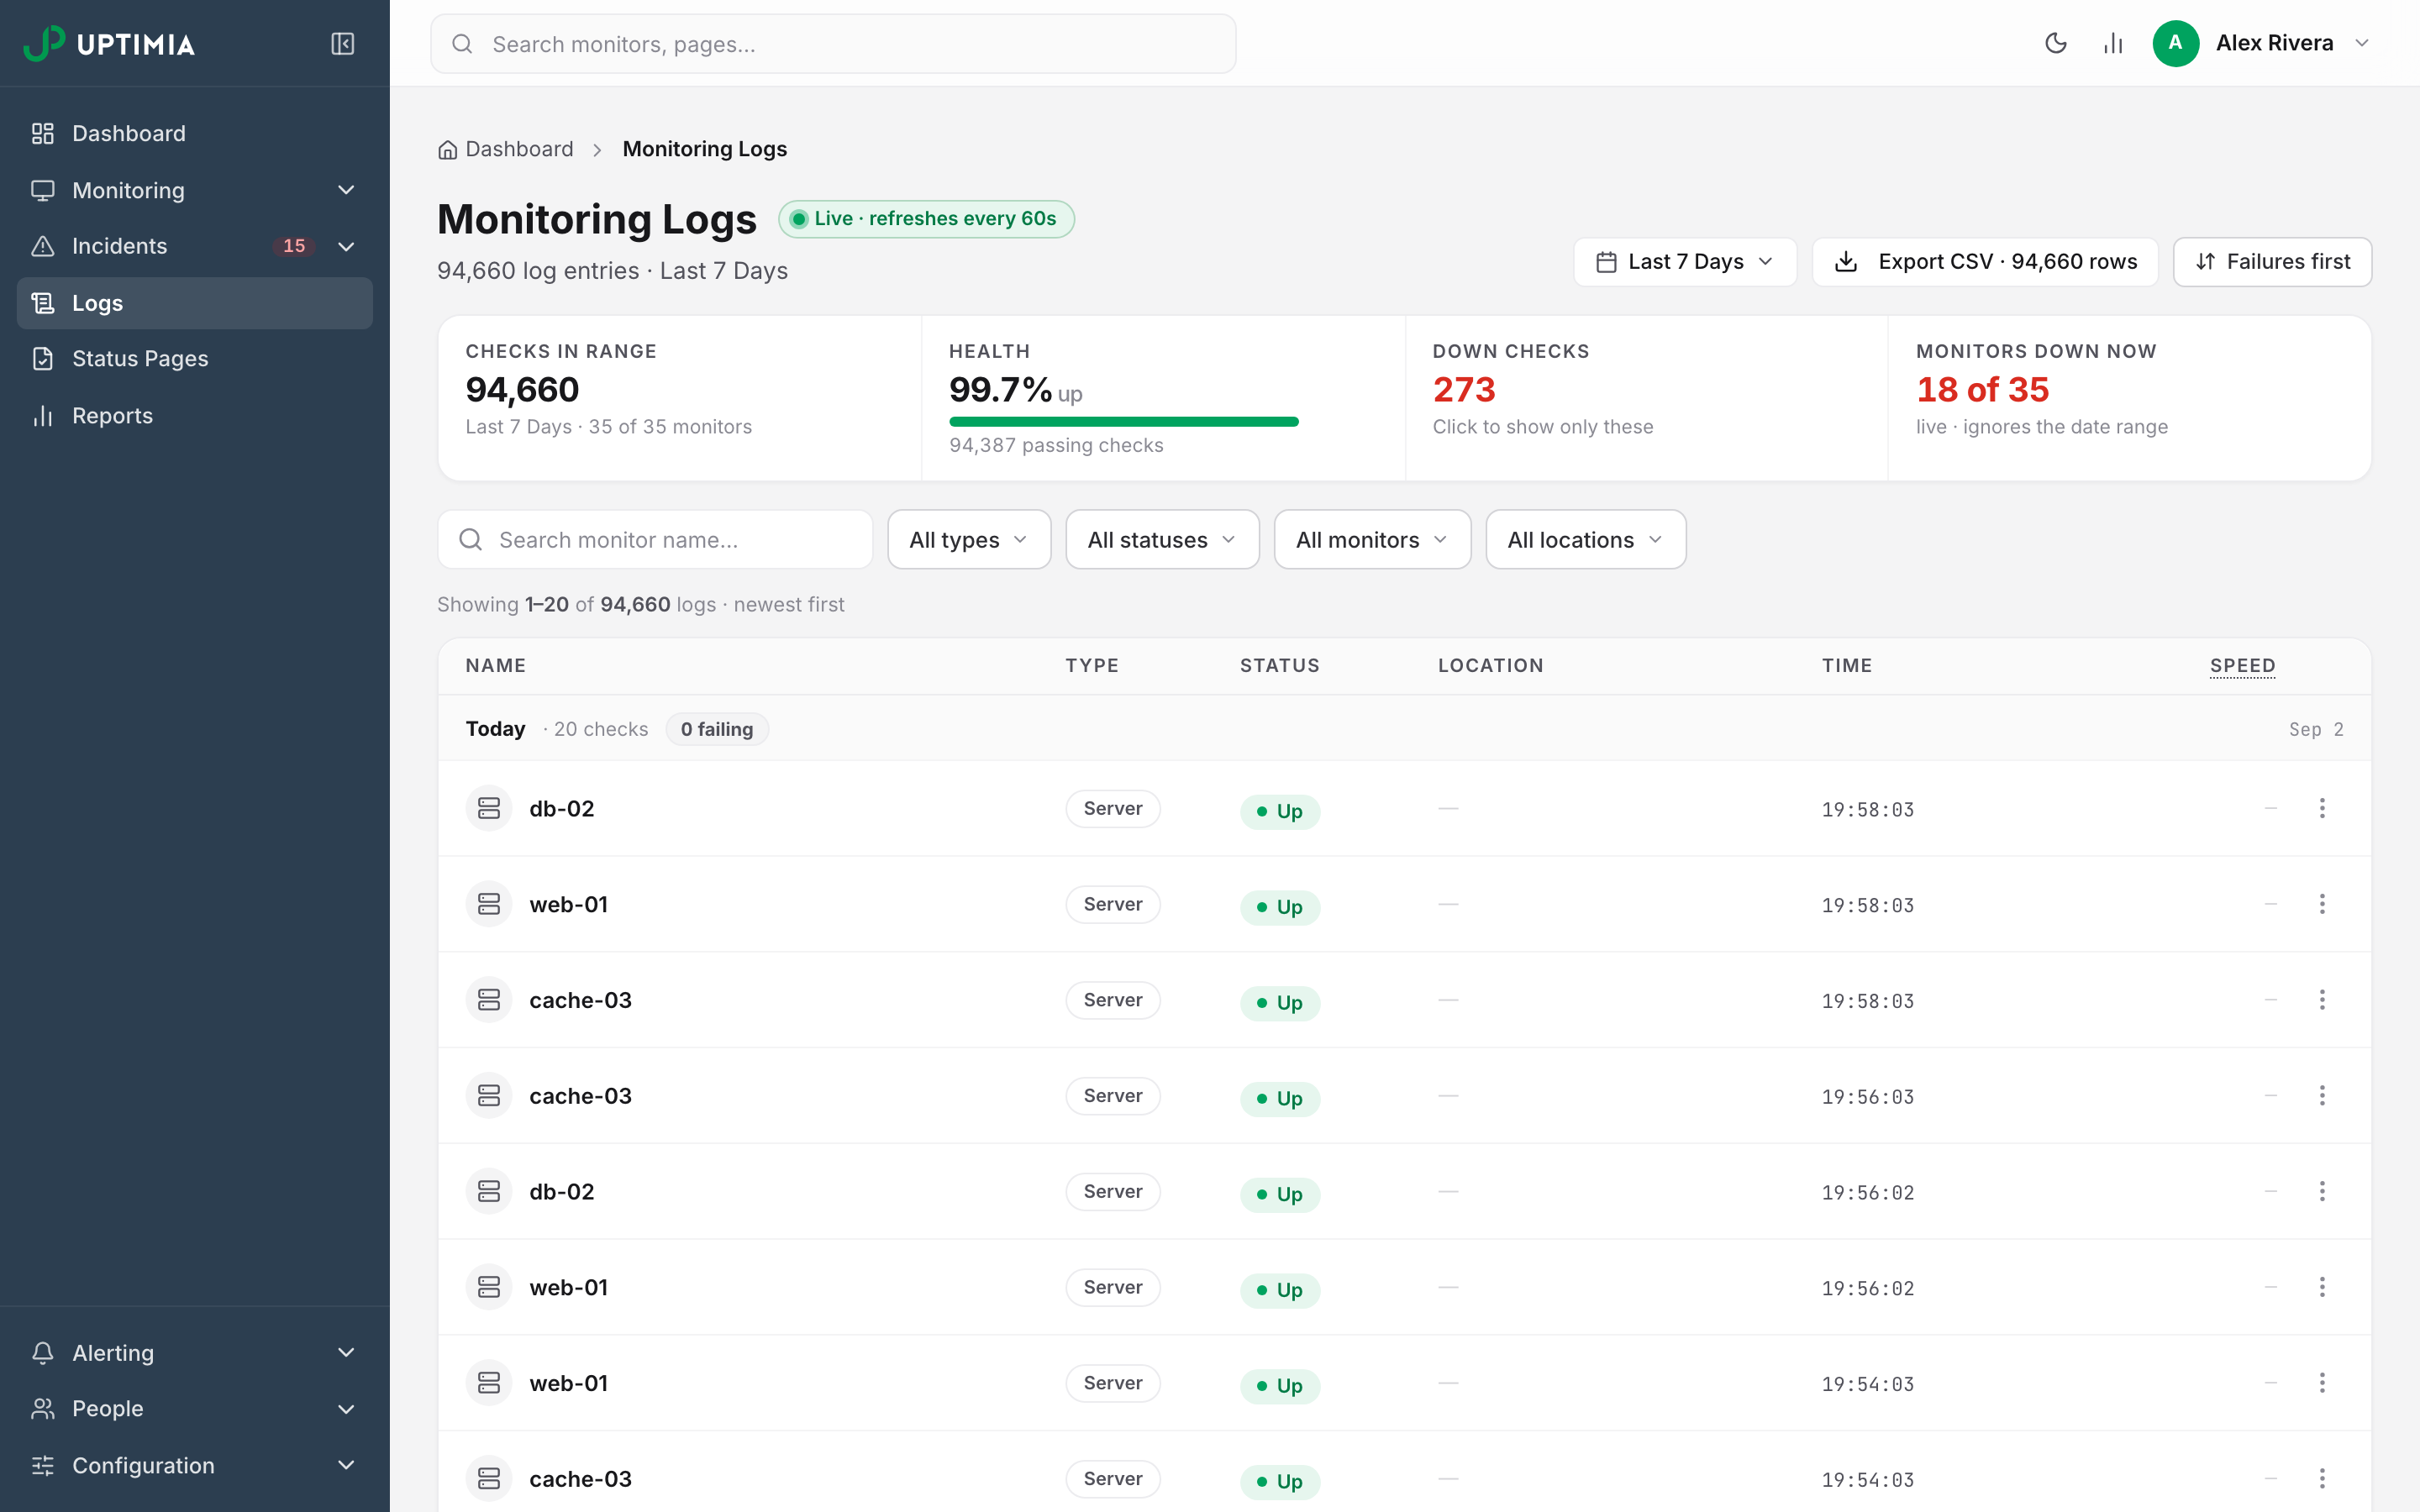
The check log holds one row per check per probe: the monitor, the probe, the status, the time and the response time. It lives on the Logs item in the sidebar, which opens Monitoring Logs.
The Filtered CSV
Set the search box, the type, status, monitor and location dropdowns, and the date range, then click Export CSV · N rows, where N is the row count your filters currently match. The file is UptimiaLogs.csv with 6 columns: Name, Type, Location, Time, Status, Duration. One export returns at most 100,000 rows. Narrow the date range or the monitor filter if the counter is higher than that.
One Check as a Document
Click a row to open the check-detail slide-over, then use its Export dropdown: Download PDF, Download HTML, Create Public Link. Both files are named Monitoring-Log. The menu at the end of the row (the three dots) offers Download PDF and Download HTML as a shortcut, without the public-link item.
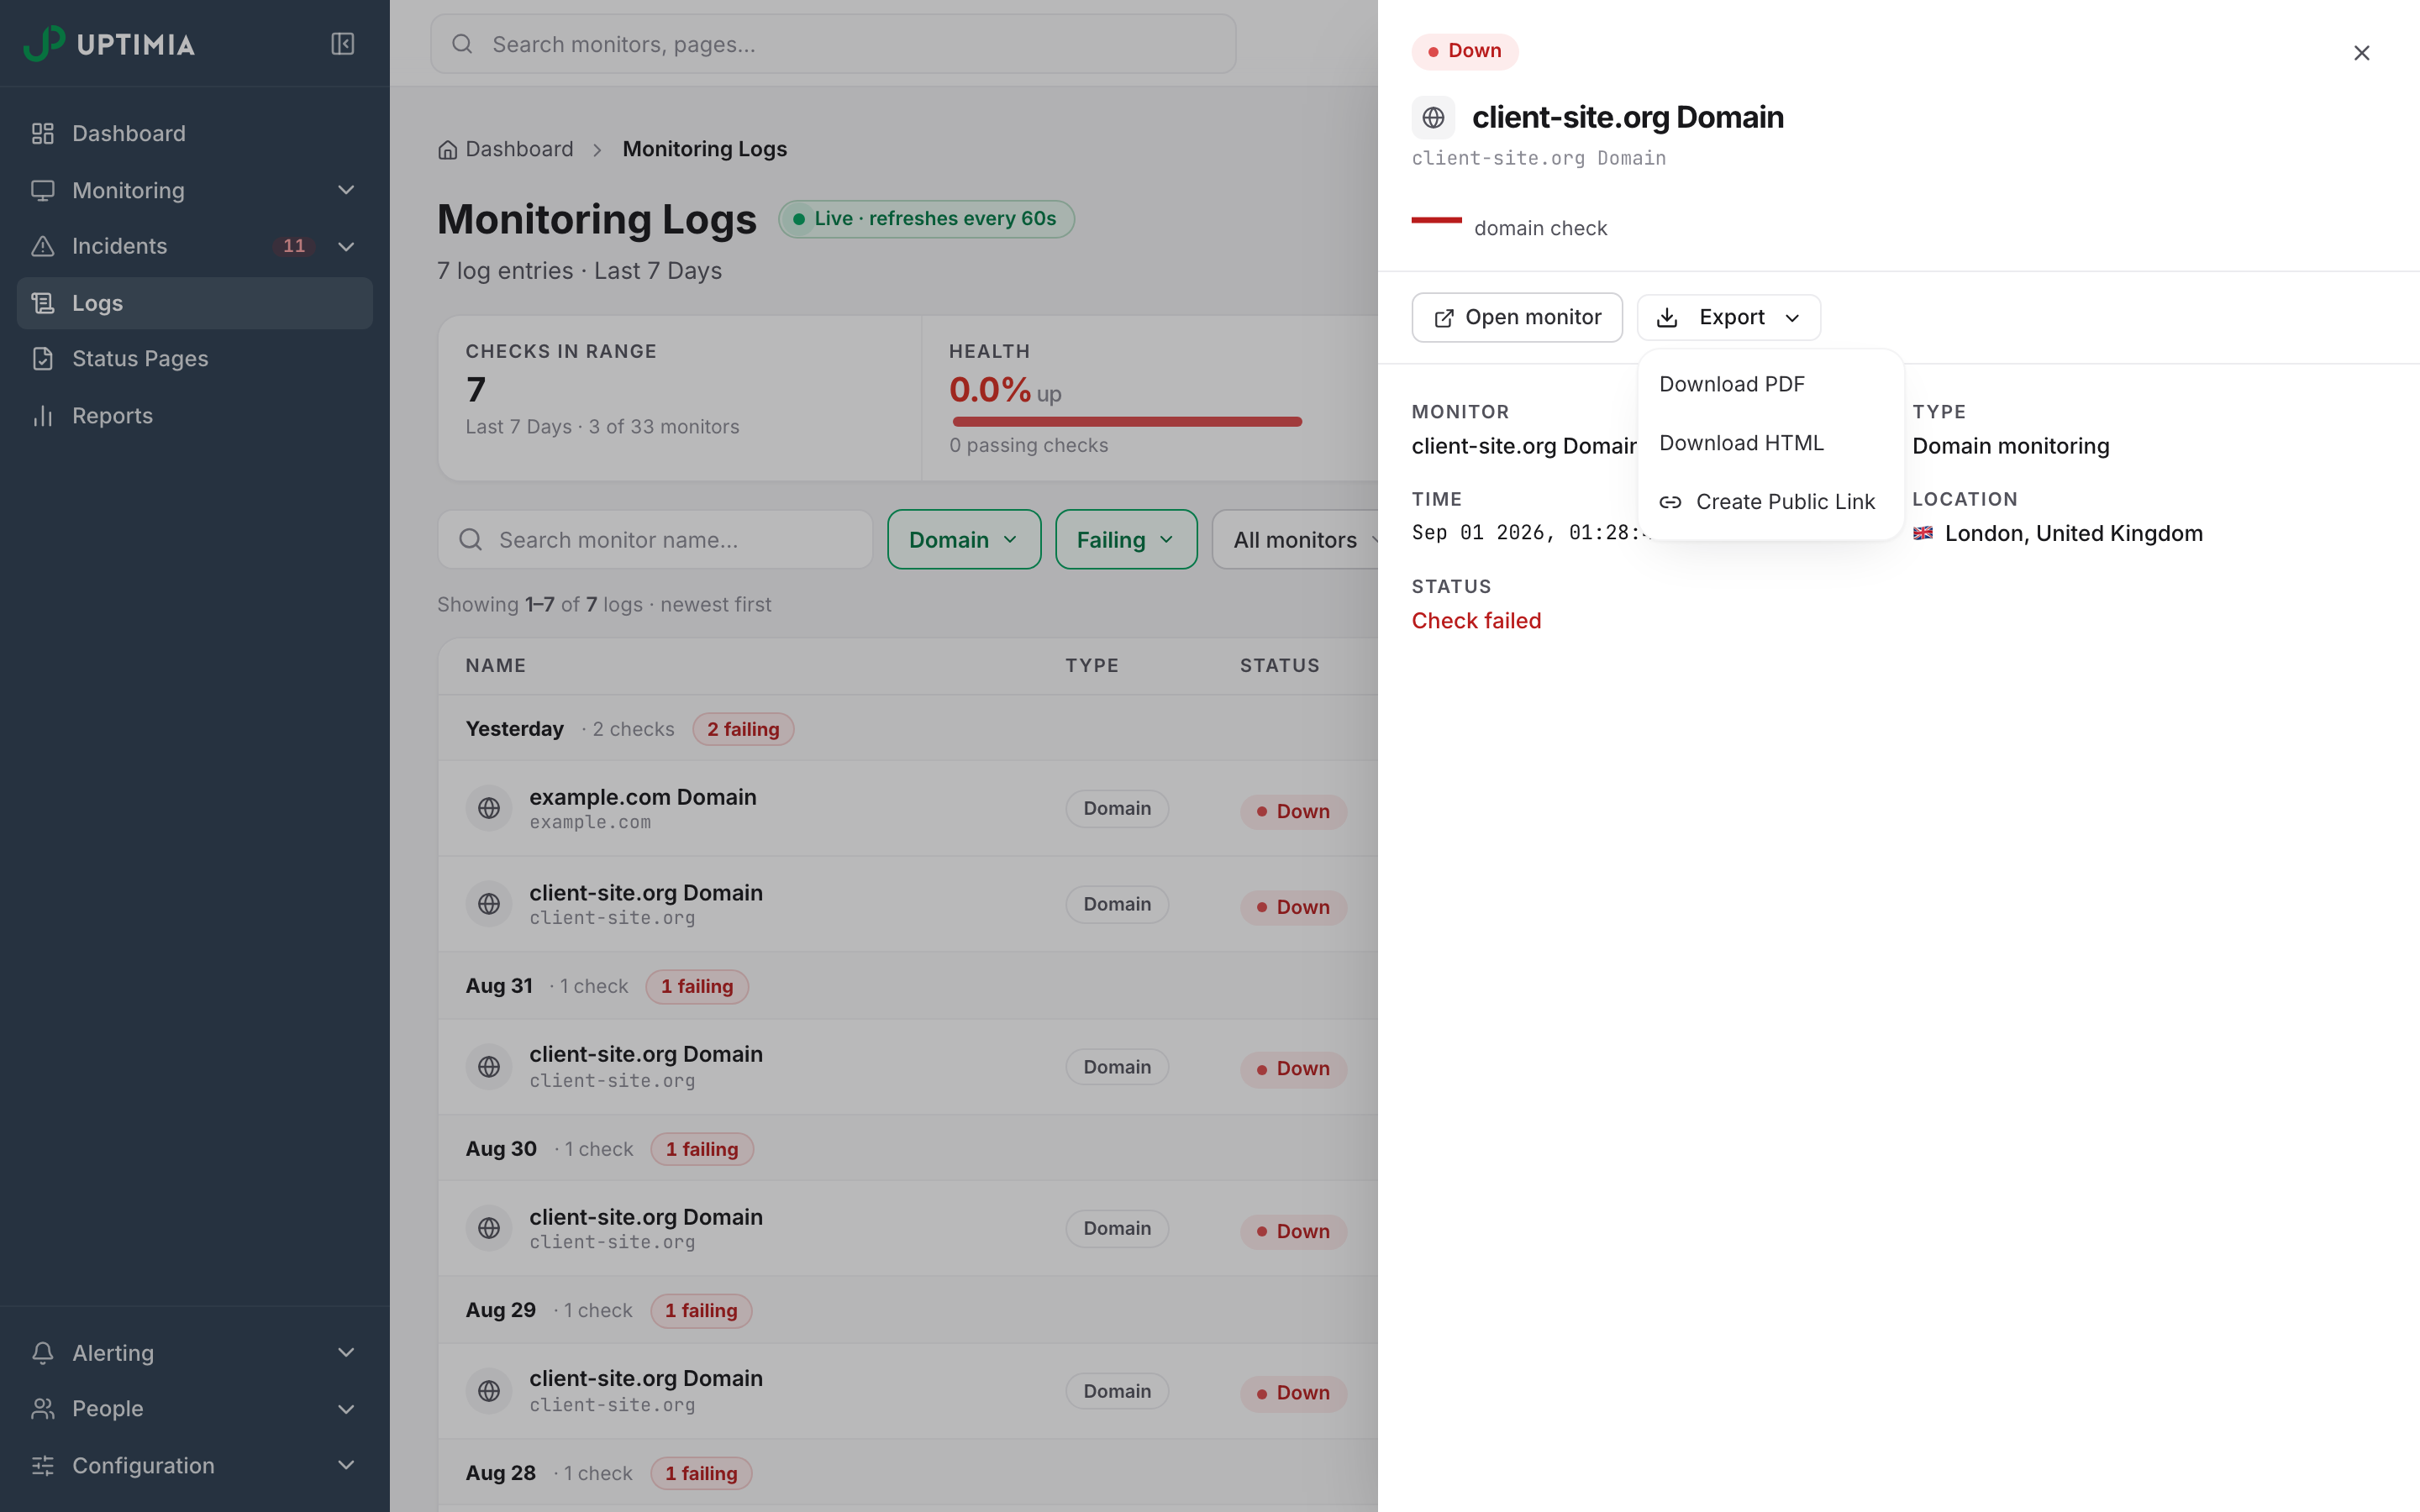
11 of the 12 families produce exportable check documents: Uptime, SSL, Domain, Virus, Speed, Transaction, Heartbeat, Server, API, DNS and Blacklist. Real User monitors collect no check rows at all, so they have no entry in the Logs page's All types filter and no export.
Family-Specific Behavior
| Family | What to expect |
|---|---|
| Server | Raw samples are kept for 24 hours and then rolled up into hourly averages. Exporting a sample older than that returns "Log entry not found". That is normal for this family, and only this family. |
| Heartbeat | Heartbeat pings appear only when heartbeat is the only type in the monitor filter. They never show up in a mixed view or a mixed CSV. Every heartbeat document redacts the ping URL to its last 4 characters. It has to: the ping URL is the monitor's only credential, and the public-link version needs no login. |
| Blacklist | The per-list table lists the zones that answered listed, informational or unreadable, plus any zone that published a positive reputation code (shown as whitelisted). Clean answers are counted in the sweep summary but not listed one by one, so an export cannot prove which zones were clean. |
| DNS | One row per sweep. Each sweep runs from a single probe, and that probe rotates through the monitor's location pool. Both the row and the document name the probe that ran the sweep. The sweep summary carries queries, nameservers answered, open changes, health issues and query errors. |
| Real User | No check log, therefore no export. Use a scheduled report for RUM summaries. |
Public Links and How Long They Last
A public link publishes a static HTML copy of one incident or one check at an address anyone can open: no sign-in, no password, no view limit.
Warning: Incident and check-log public links never expire. Nothing sweeps them. The generated page stays reachable by anyone holding the URL until it is removed by hand, and the 30-day cleanup that clears report snapshots never touches it. Treat an incident or check link as permanently published, and send a PDF instead when the recipient does not need a live URL.
The URL is unguessable, a random 32-character hash, but you cannot revoke it yourself. If you need one taken down, contact support with the full URL.
Report public links are HTML snapshots, and a daily cleanup deletes any snapshot older than 30 days. A report link stops working after that; a downloaded PDF, HTML or CSV does not. Scheduled Reports covers report exports in full.
How Far Back an Export Can Reach
Your plan sets the readable history window: 7 days on Free, 30 on the trial, 90 on Basic, 365 on Professional, 730 on Enterprise. Data and Log Retention lists those numbers and explains how upgrading changes them.
Charts and exports behave differently, which is why two screens can disagree:
- Ask an Uptime, Speed or Virus history chart for a date earlier than your plan allows, and it moves the start date forward to your plan's earliest date. You get the shorter window with no error. The other families' monitor pages do not move your start date, so they can show rows older than your plan's window.
- CSV exports never move your start date. They return every row still stored in the range you asked for. On a short-window plan that can be more than an Uptime, Speed or Virus monitor page shows you.
Uptimia eventually deletes old rows, but never sooner than your plan's window. Export before the data ages out and keep the file.
Choosing a Format
| You want to | Use |
|---|---|
| Analyze in a spreadsheet, or re-import elsewhere | CSV from the list view |
| Hand one incident to a customer or an auditor | Download PDF |
| Attach one check result to a ticket | Download HTML |
| Let someone without an account read it in a browser | A public link (permanent for incidents and checks) |
| Automate a nightly pull | The Uptimia API |