
Every Uptimia plan carries a monitoring-history window: how far back your charts, incident lists, check logs and exports reach. Uptimia enforces that window when you read uptime, Speed and virus history, rather than by deleting anything, so moving to a bigger plan gives you the longer history on your very next page load. Only the nightly prune actually removes rows. What the window does to an availability percentage over a long range is in How Uptime Is Calculated.
Retention Is a Read Limit, Not a Delete
Uptimia has two separate retention mechanisms. Only one of them decides what you can see.
The first is the readable window. However you ask for uptime, Speed or virus history, Uptimia raises the requested start date to your plan's floor. Ask a Basic account for 12 months of uptime history and you get 90 days back, with no error and no warning. Leave the date range out on the Monitoring Logs feed and you get the last 7 days, not everything. A chart on a monitor page opens on its own shorter default, never on the whole window.
For the other families, Uptimia answers with whatever rows are still in storage, and on a paid plan those rows reach further back than the window in the table below. Server metrics go the other way: they sit on their own fixed schedule, described in Server Monitoring.
The second mechanism is a nightly prune that removes old rows from storage. For every family it touches, the cutoff sits at or beyond the readable window on every plan, so the window is the boundary you meet first: Uptimia never deletes history you are still entitled to read. Server monitoring skips the prune. It keeps its own fixed schedule.
Monitoring History by Plan
| Plan | Readable monitoring history | Label in the plan comparison table |
|---|---|---|
| Free | 7 days | 7 days |
| Trial | 30 days | 30 days |
| Basic | 90 days | 3 months |
| Professional | 365 days | 12 months |
| Enterprise | 730 days | 24 months |
The figures above are the window your plan is sold on, and uptime, Speed and virus history is held to them. Treat the figure as a guarantee. The other families can return more.
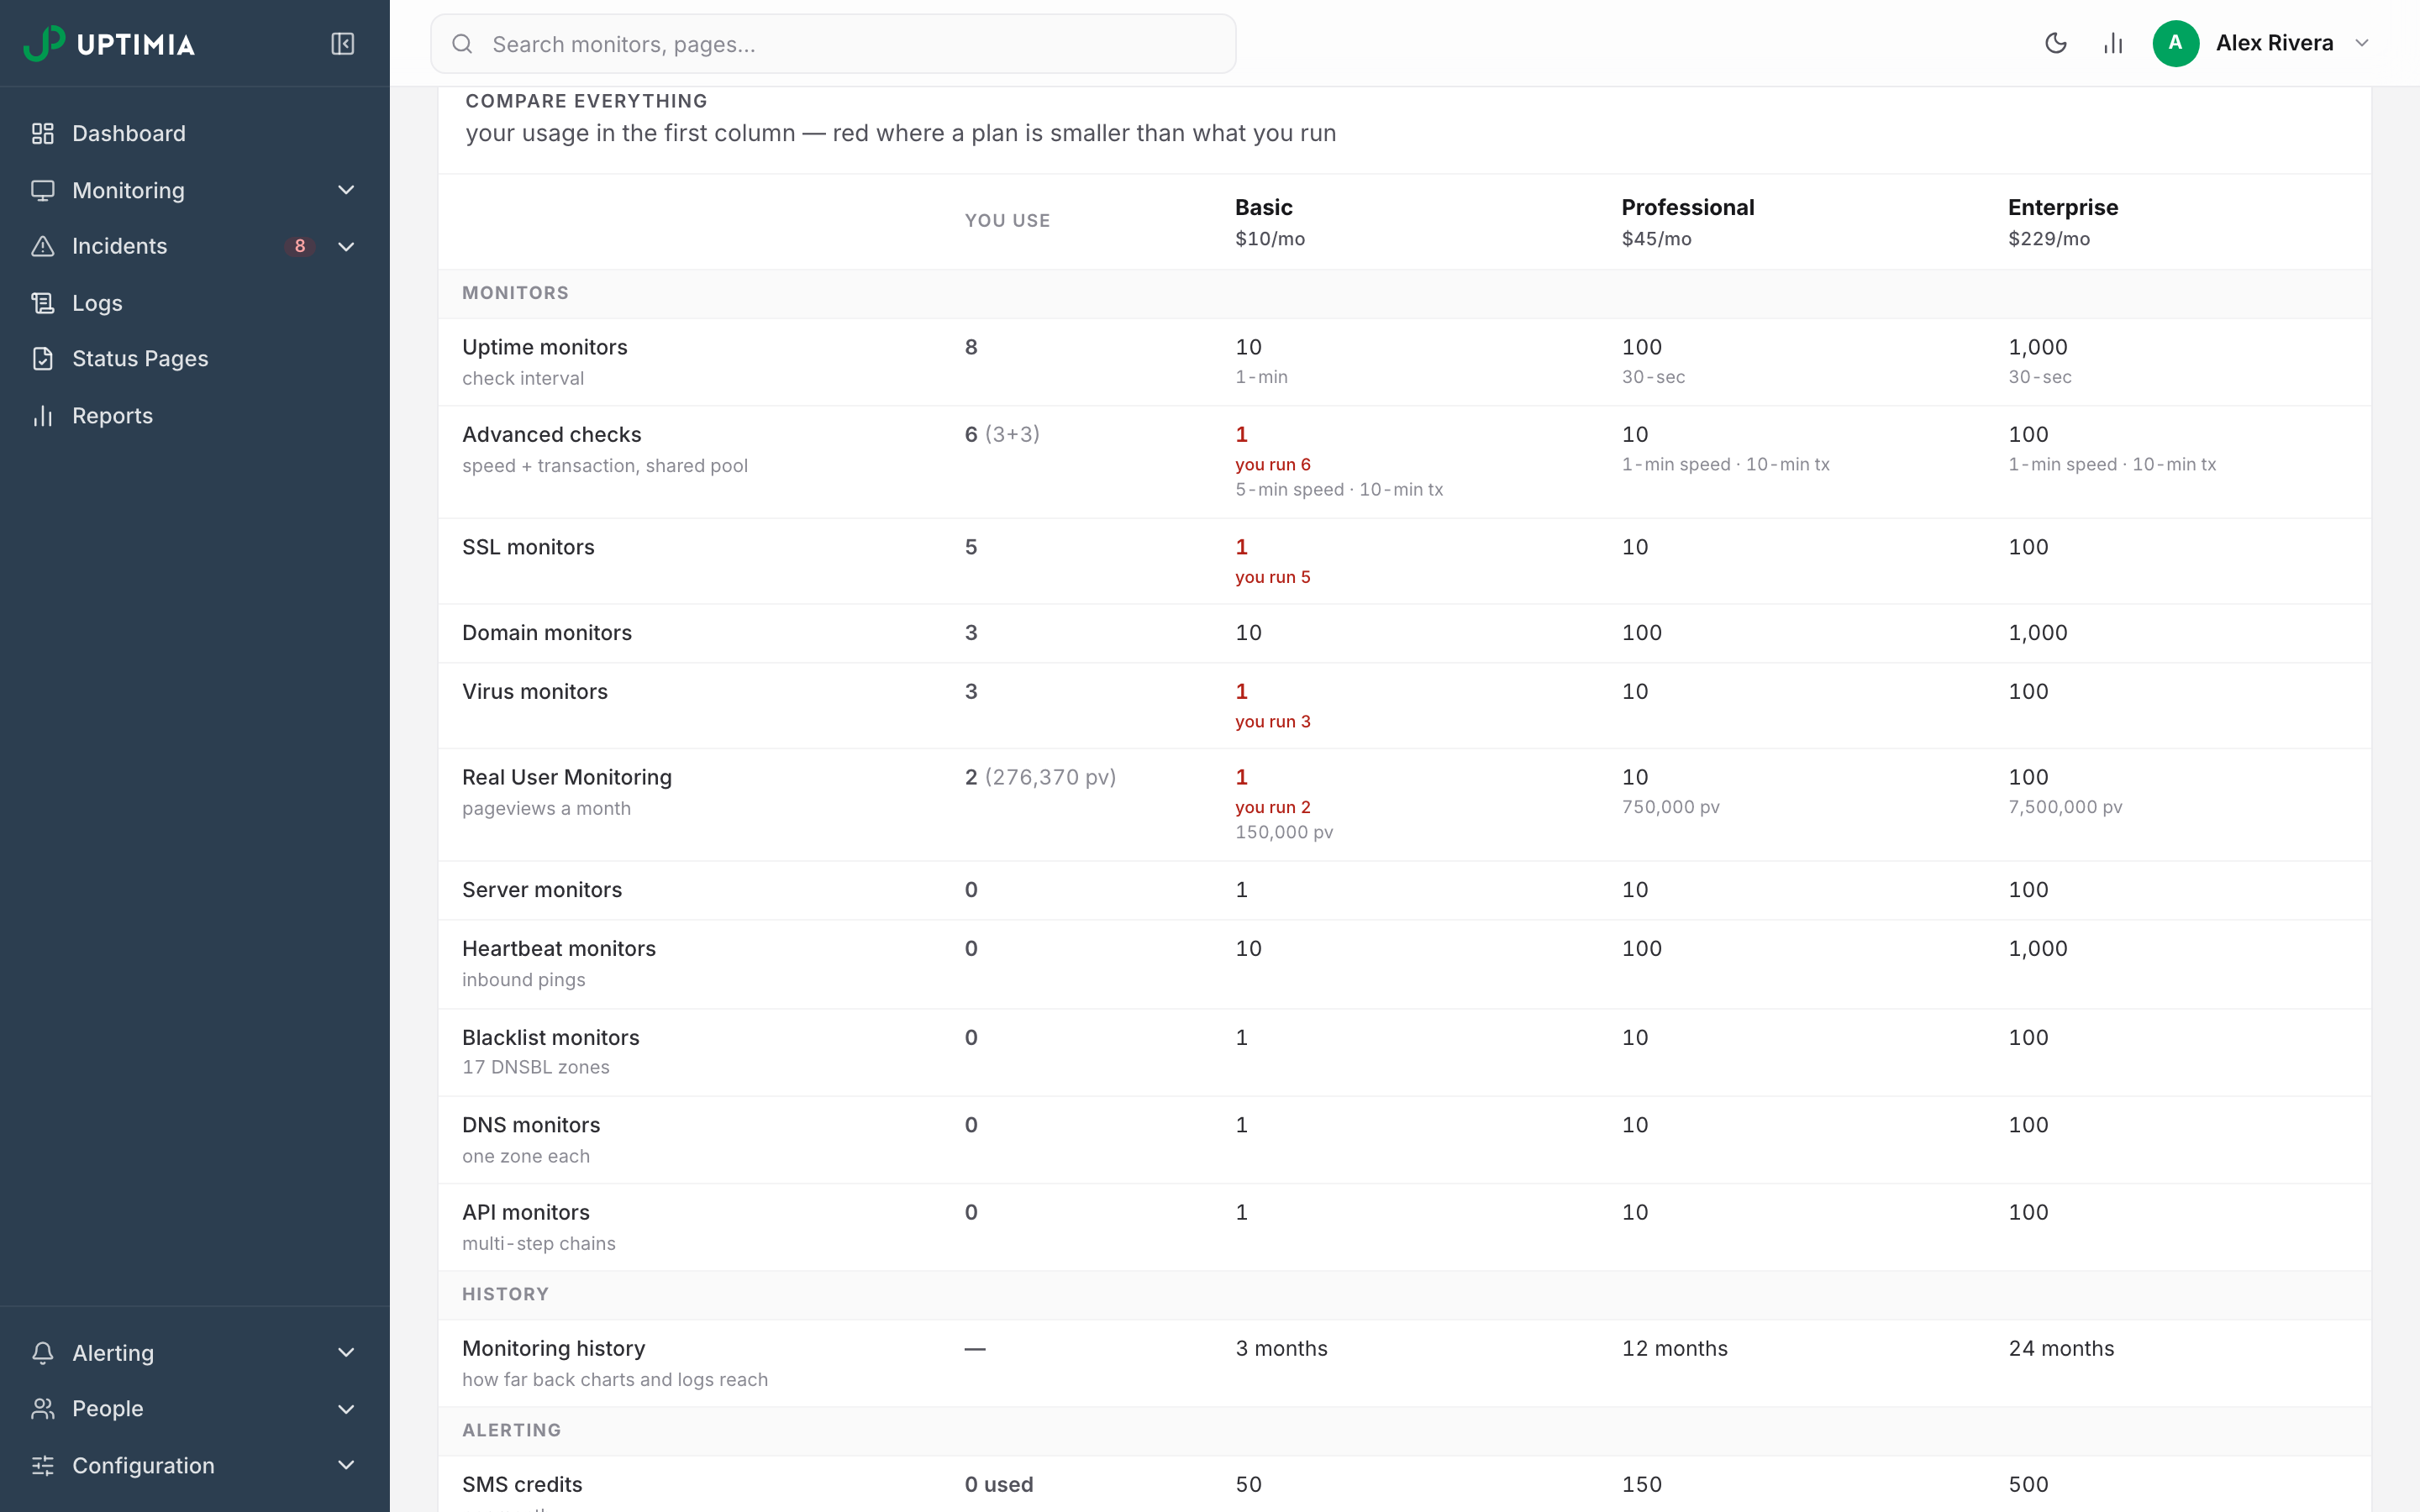
The public pricing page states the paid windows as 90 days, 12 months and 24 months. The control panel's comparison table converts anything past 60 days into months, so Basic reads there as "3 months". Both describe the same 90 days.
To check the window on your own account, open the avatar menu (top right) → Plans & Billing, then read the Monitoring history row of the plan comparison table. Opening that page needs billing access. Ask the account owner if your role does not have it.
An account on a retired tier reads the same 365-day window as Professional.
What the Window Applies To
Uptimia keeps two kinds of monitoring data. The window in the table above is quoted for both.
| Data | What it is | Where you read it |
|---|---|---|
| Check logs | One row per check, per probe: the result, the response time and the error, for every check a probe ran. The most granular data, and by far the largest in volume. | The Logs item in the sidebar, which opens Monitoring Logs, and the Check log card on each monitor |
| Reports and incidents | The aggregated history: availability percentage and average response time over time, plus the record of every incident (when it started, when it ended, and the error that opened it) | Monitor detail pages, the Incidents card, status pages and scheduled reports |
One rule sits outside the plan ladder. For uptime checks, Uptimia clears the stored response body and the failure-reason text 7 days after the check, on every plan. Older uptime check rows keep their timing, status code, probe and pass/fail result, but open with an empty response body and an empty error. The incident record for the failure keeps its own error text for the full window.
Within your plan's window everything reads the same. The difference shows only after an upgrade on Basic or above, where SSL, Speed, heartbeat, DNS, blacklist or API history can reach further back than uptime history. Uptime check logs are stored for less time than the other families'.
Upgrading Widens the Window Instantly
Because the window is a read limit, an upgrade is retroactive. History that was invisible an hour ago is visible on the next request, in the same charts, with no import step and no support ticket.
An upgrade cannot restore rows the nightly prune has already removed. Free and Trial accounts store only a little more than they can read. Upgrading a long-standing Free account will not surface a year of check logs, because most of that period was never kept.
An upgrade exposes every row still in storage. For SSL, transaction, heartbeat, blacklist, DNS, API and domain history that is the whole longer window. Speed and virus history is read-limited like uptime, so an upgrade exposes the new plan's window and no more. Uptime check logs are the exception: after an upgrade an uptime check log can reach less far back than an SSL or API one for the same period. Reports, incidents and availability history are unaffected. On Free, export anything you need to keep before it ages out of storage.
Retention Outside Monitoring History
Two other retention windows do not follow the plan ladder.
| Data | Kept for | Notes |
|---|---|---|
| Audit Log | 12 months | Same on every plan. Reached from People → Audit Log; Owner and Admin only |
| Public link on a report | 30 days | The shareable web copy of a report that anyone can open without signing in. The report itself is unaffected |
Why Older History Can Look Empty
A blank chart before a certain date has four common causes. Check them in this order:
- The range is outside your window. For uptime, Speed and virus history your request was raised to the plan floor, so anything earlier returns nothing. A monitor detail page and a long custom range on the dashboard can disagree for exactly this reason. See How Uptime Is Calculated.
- The monitor did not exist yet. History starts at the monitor's first check, never before it.
- The monitor was paused or suspended. No checks run in either state, so there is a real gap in the timeline.
- The monitor was in a maintenance window. Uptimia discards a result that arrives during maintenance the moment it lands, so the gap is genuine.
Causes 2, 3 and 4 explain an empty timeline on a public status page too: there is no data to draw for that range. Cause 1 never applies there: a status page always draws the same fixed 90-day timeline.
Keeping Data Past Your Window
The window is fixed by your plan and cannot be widened for a single account, so anything you need beyond it has to leave Uptimia before it ages out. Three routes, cheapest first:
- Export the check log to CSV from Monitoring Logs while the range is still readable. This is the only way to keep per-check detail.
- Schedule a recurring report. A scheduled PDF, HTML or CSV report lands in an inbox on its own cadence and stays there after the source data leaves your window. It is the simplest durable archive.
- Pull the history through the API on a schedule of your own. See Getting Started with the Uptimia API. Uptime, Speed and virus history is still limited to the same window, so a job covering those families has to run inside it.
Exporting Your Data covers the formats and where each export lives.