
A scheduled report is an email summary of your monitoring data, sent on a repeating schedule to the contacts you choose, carrying incident counts and per-monitor uptime figures and, optionally, every incident and maintenance window in the period. A custom report is the same document built once for a date range you name, and delivered by email, download or public link. Every account also starts with four recurring reports it did not create. For an ad-hoc pull of raw incidents or check results, see Exporting Your Data. You can also list, create, send, export and share reports from a script. See Getting Started with the Uptimia API.
Before You Start
- Creating, editing, sending and deleting reports is available to Owner, Admin and Editor. A Read-only member sees the Reports list and can run Export PDF, Export HTML and Export CSV. The create buttons and the rest of the actions menu are hidden.
- Your account email must be verified. Until it is, Send Immediately and a custom report set to Send as email are both refused. Scheduled sends are skipped silently, so an unverified account never receives its reports. Custom reports delivered by Download or Public link still work, and so do the three exports.
- Branding themes on reports require the Professional plan or above. Creating a theme on a lower plan returns "White-label branding is available on the Professional plan and above." An existing theme keeps working after a downgrade.
Reports You Did Not Create
Uptimia seeds every account with four recurring reports when it is created: Daily reports, Weekly reports, Monthly reports and Yearly reports. All four cover all monitors and go to the account's Main e-mail address contact. Only Daily reports has Show all incidents turned on; the longer cadences summarize instead, because a year of per-incident rows is unreadable. None of them attaches a file. None uses a branding theme.
They are ordinary reports. Edit their frequency, coverage and recipients, or delete the ones you do not want.
Creating a Recurring Report
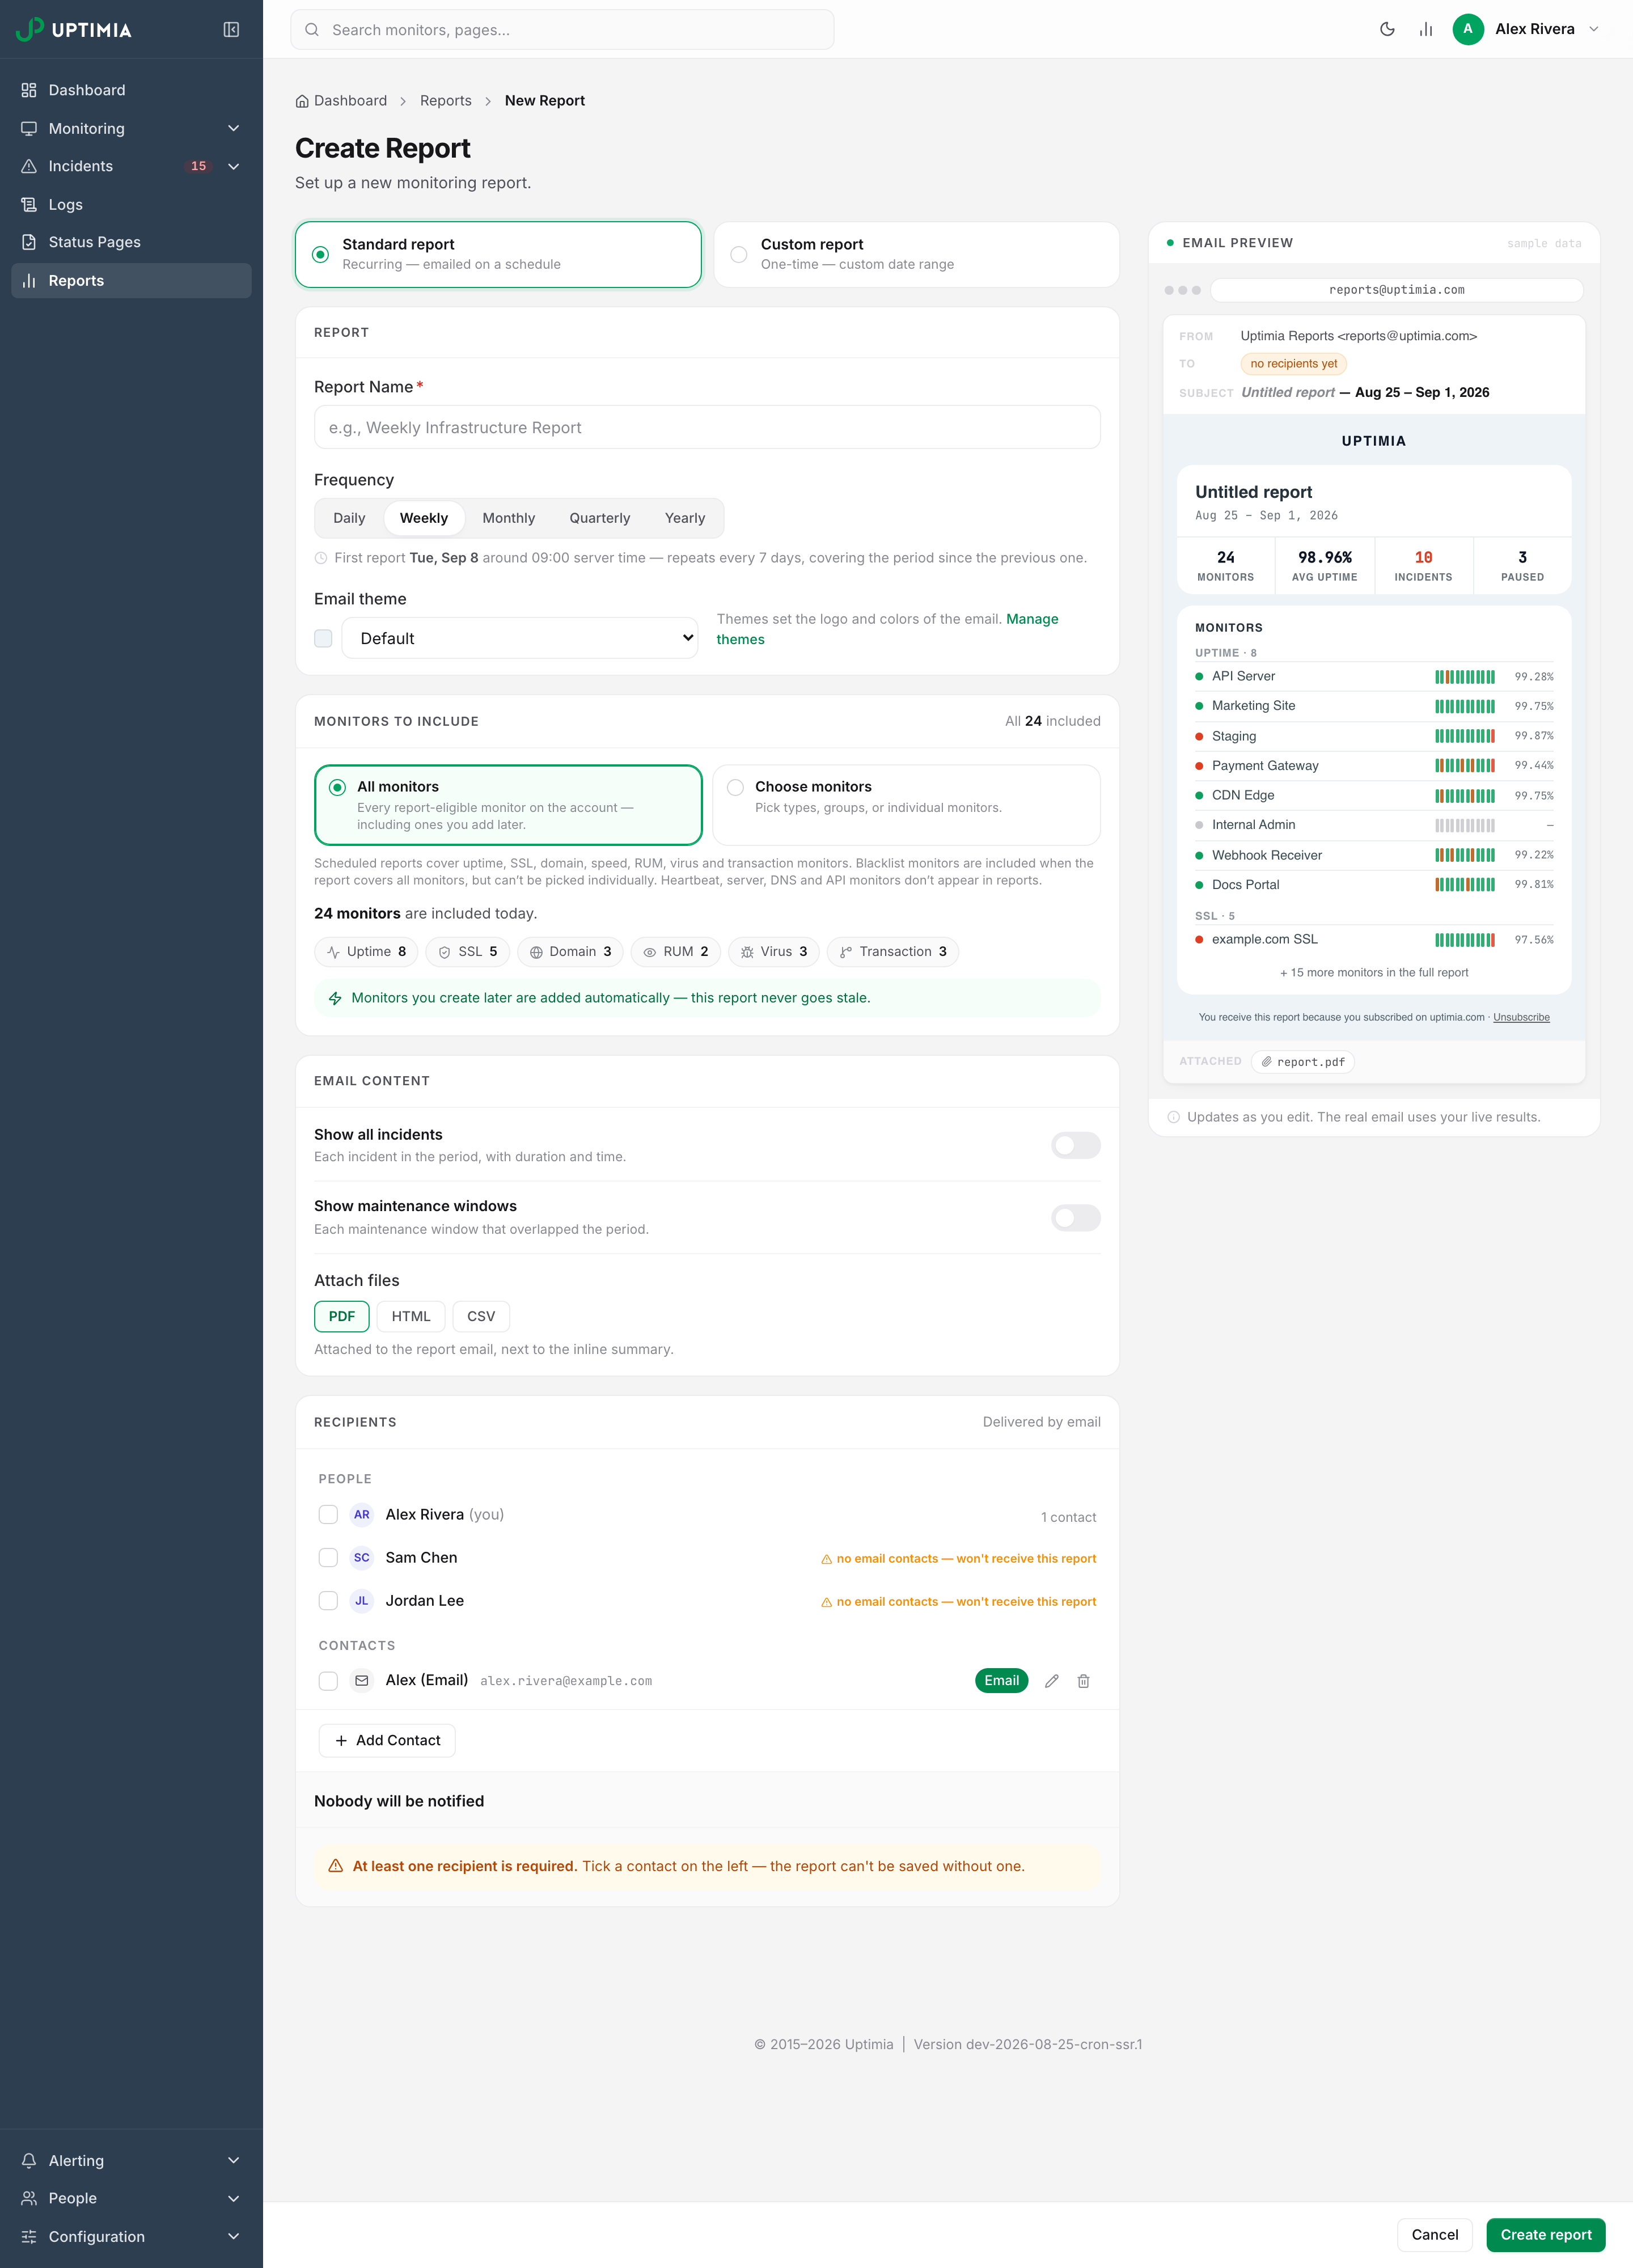
- Go to Reports in the sidebar and click Create Scheduled Report.
- Enter a Report Name. It identifies the report in the Reports list, and never appears in the email itself. The email carries its own subject built from the frequency, such as "Weekly uptime report" or "Monthly uptime report for August". Daily reports put an incident count, or "No incidents:", in front of that subject.
- Pick a Frequency: Daily, Weekly, Monthly, Quarterly or Yearly. The line beneath states the first send date.
- Pick an Email theme, or leave it on Default.
- In Monitors to include, keep All monitors or switch to Choose monitors.
- In Email content, set Show all incidents and Show maintenance windows, then choose attachments under Attach files.
- Under Recipients, tick at least one email contact.
- Click Create report in the bottom save bar.
The editor is two panes: the form on the left, and on the right a live email preview that redraws with the real theme, monitor selection, toggles and attachment chips. It is a sketch of the email, not a copy. The panel is marked sample data, and the delivered email carries its own subject and its own summary grid.
When a Report Goes Out
A report goes out within 10 minutes of falling due, so each cadence lands shortly after 09:00 server time:
| Frequency | Next send lands |
|---|---|
| Daily | Tomorrow |
| Weekly | 7 days from now |
| Monthly | The 1st of next month |
| Quarterly | The 1st of the next quarter |
| Yearly | 1 January |
Daily, Monthly, Quarterly and Yearly reports cover the previous calendar period and end at 23:59:59 the day before the send. A Weekly report follows calendar weeks instead of its own send day: it starts on a Monday, still ends yesterday, and unless it happens to send on a Monday it covers 8 to 13 days. In that case the window overlaps the report before it.
Monitor Selection
All monitors means every report-eligible monitor on the account, including ones you add later. Some families are never eligible. The editor says which, under the mode cards: "Scheduled reports cover uptime, SSL, domain, speed, RUM, virus and transaction monitors. Blacklist monitors are included when the report covers all monitors, but can't be picked individually. Heartbeat, server, DNS and API monitors don't appear in reports."
Monitor Type Coverage lists which family appears where.
In Choose monitors mode the picker lists monitors grouped by type: Uptime, SSL, Domain, RUM, Virus and Transaction, with a search box, a per-type checkbox and an Add group button that pulls in a whole monitor group at once. Speed has no row. The hint line above still names it. In the control panel, a Speed monitor reaches a report only when that report is set to All monitors.
Ticking a type's checkbox sets a rule, not a list. The row gains an auto-includes new badge, and monitors of that type created later are included without you editing the report. The card header keeps a live N of M included count. A Choose monitors report with nothing selected cannot be saved.
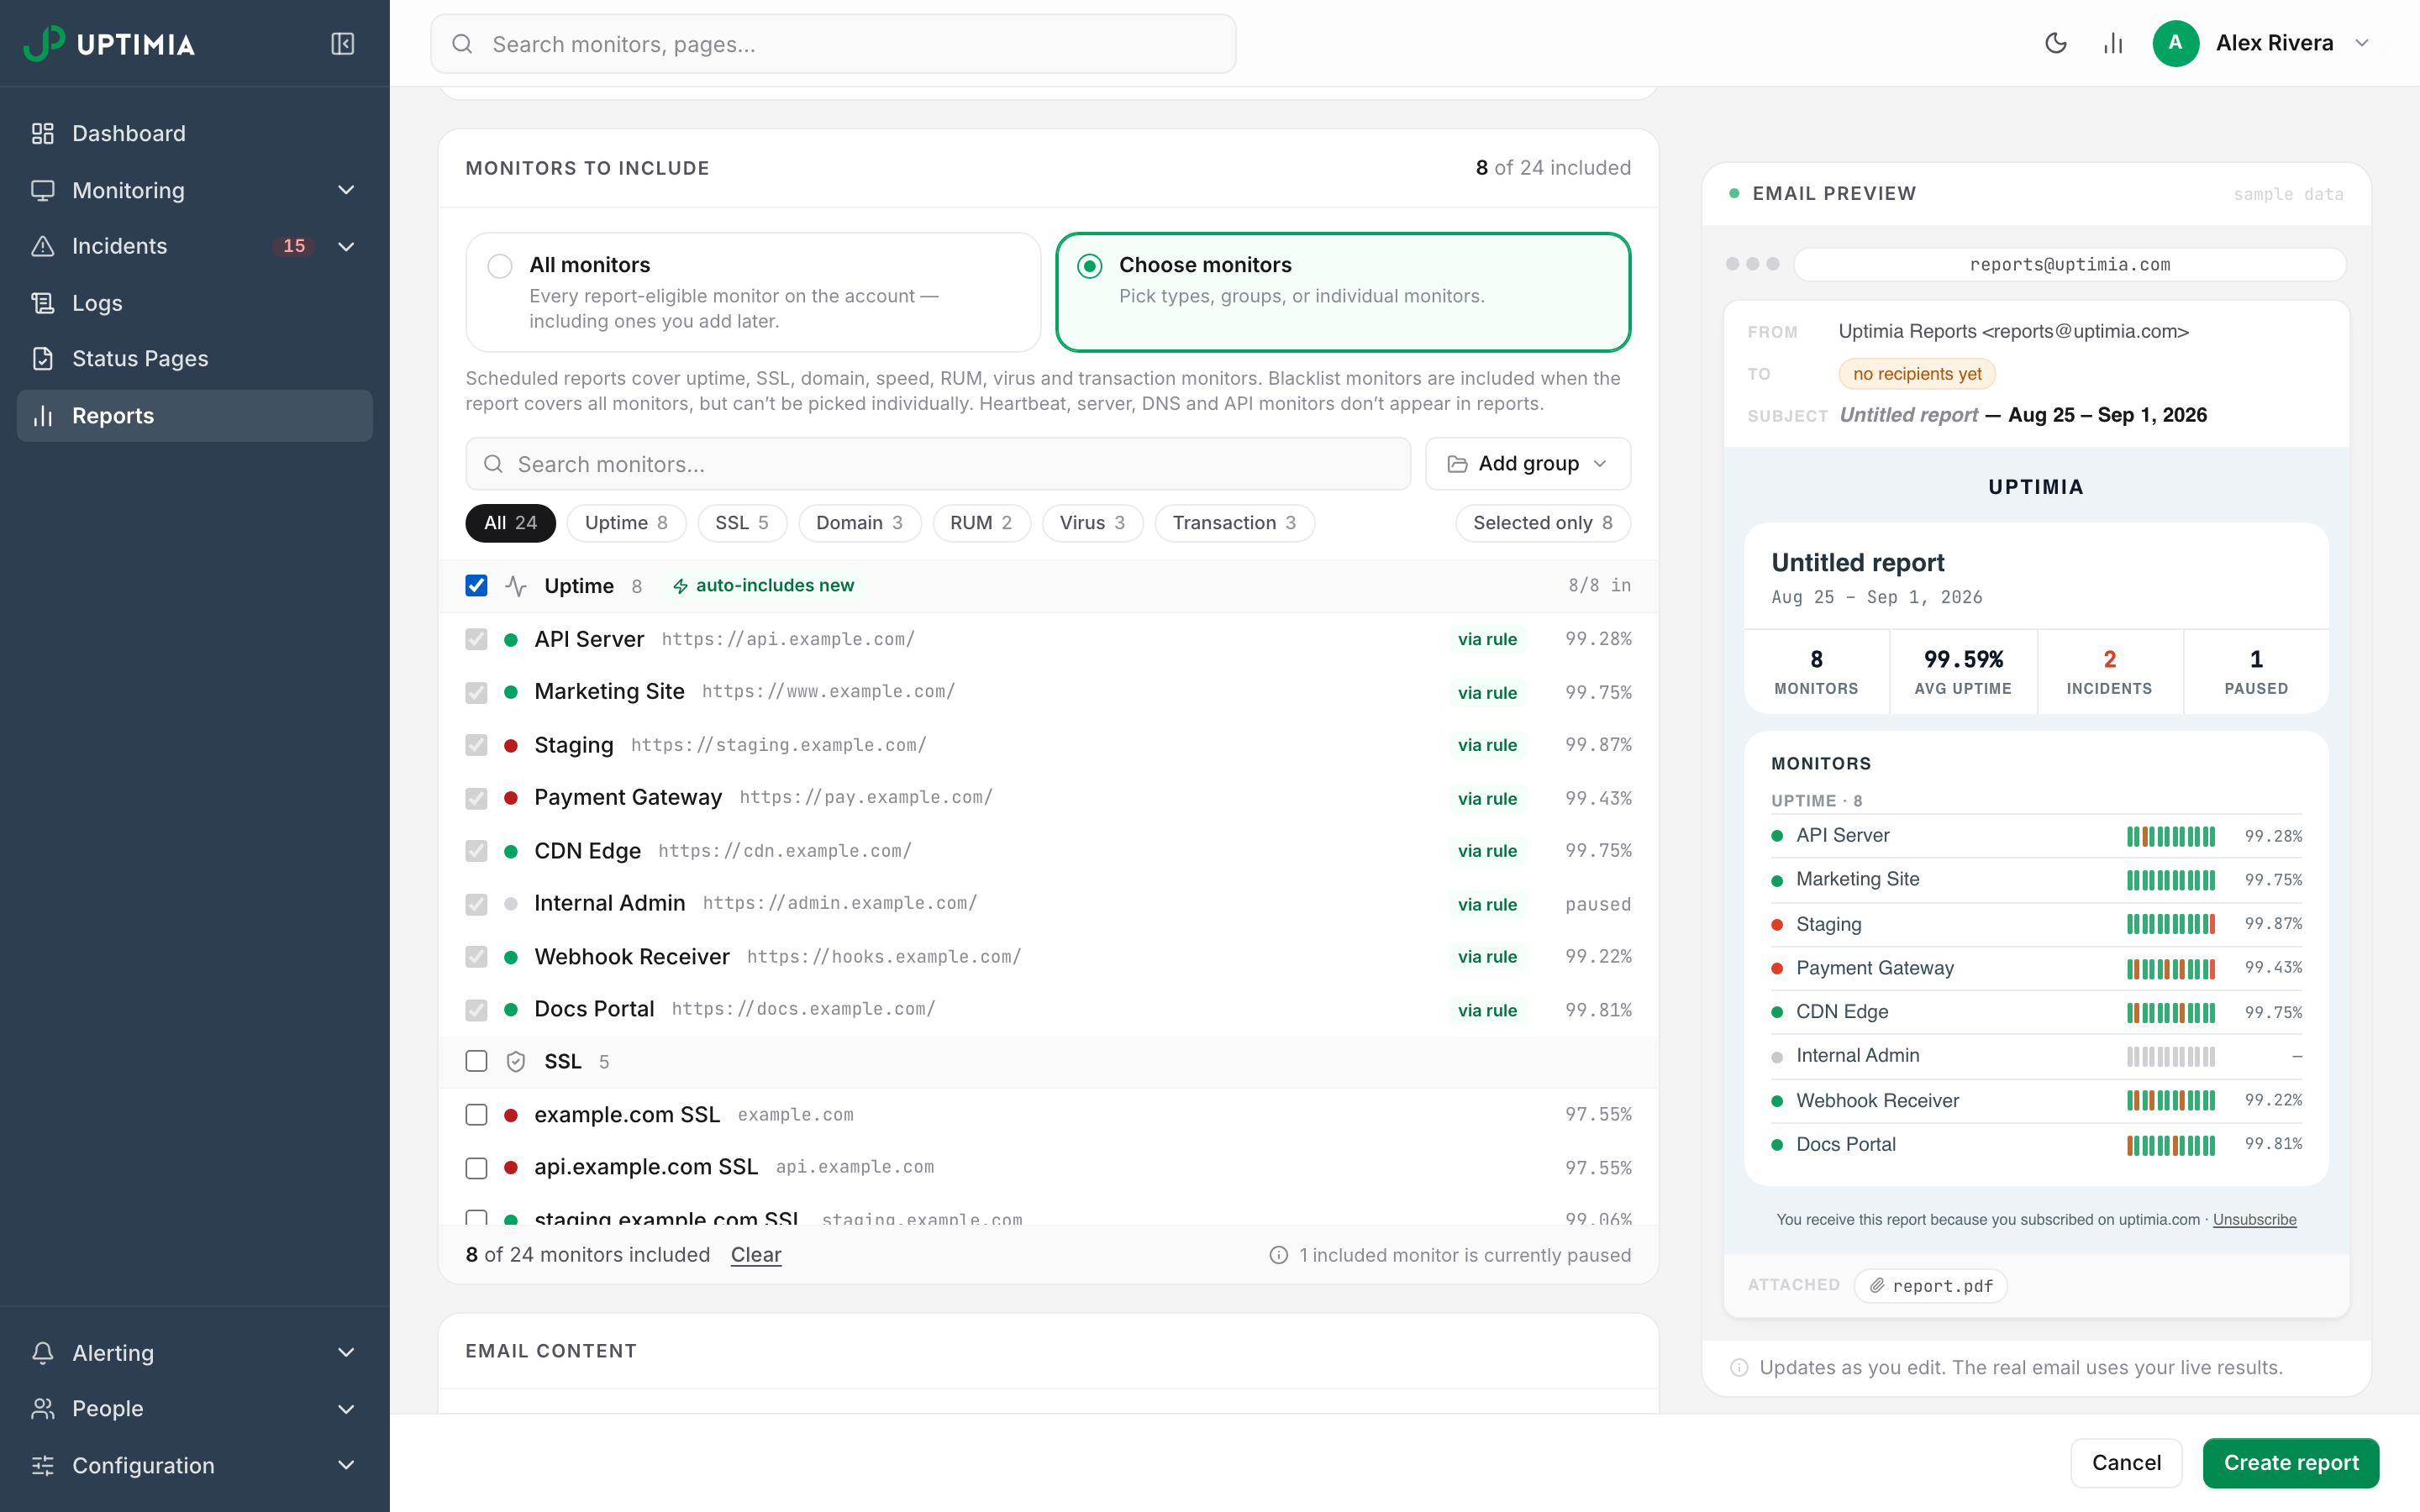
Note: The report picker labels this family RUM, as most of the control panel does. The sidebar's Monitoring menu and the monitor list page call the same family Real User.
Email Content
| Setting | Default | What it adds |
|---|---|---|
| Show all incidents | Off | Each incident in the period, with duration and time |
| Show maintenance windows | Off | Each maintenance window that overlapped the period |
| PDF attachment | On | The report as a PDF file on the email |
| HTML attachment | Off | The report as a standalone HTML file |
| CSV attachment | Off | The report's figures as a spreadsheet |
Turn Show all incidents on when the report is going to an auditor, a service-level agreement (SLA) review or a post-mortem. Leave it off for a routine stakeholder summary.
Whatever you choose, the email body opens with a summary grid: Total monitors, Critical incidents and Non-critical incidents. A second row counts SSL certificates and domains expiring soon, and infected websites, when the report covers those families. The per-family breakdown follows.
Branding
Email theme sets the logo and colors of the report email. The select shows a color swatch of the theme's main background, and Default at the top of the list is the standard Uptimia look. The Manage themes link beside it opens Configuration → Branding Themes, the same page the sidebar reaches. See Branding.
Recipients
Reports are delivered by email, so the picker offers email-capable contacts only. A report cannot be saved with no recipients. The panel turns red with "Tick a contact on the left — the report can't be saved without one".
Sending a One-Time Custom Report
Use a custom report when you need a specific window, such as a migration weekend or last quarter, without adding a schedule.
- From Reports, click Send Custom Report.
- Enter a Report Name.
- Set Start Date and End Date, or use the Last 7 days / Last 30 days / Last month presets. Dates are read in the server's time zone.
- Choose the monitors, the Email theme and the Email content toggles as above.
- In Delivery, pick Send as email, Download or Public link.
- Click Generate report.
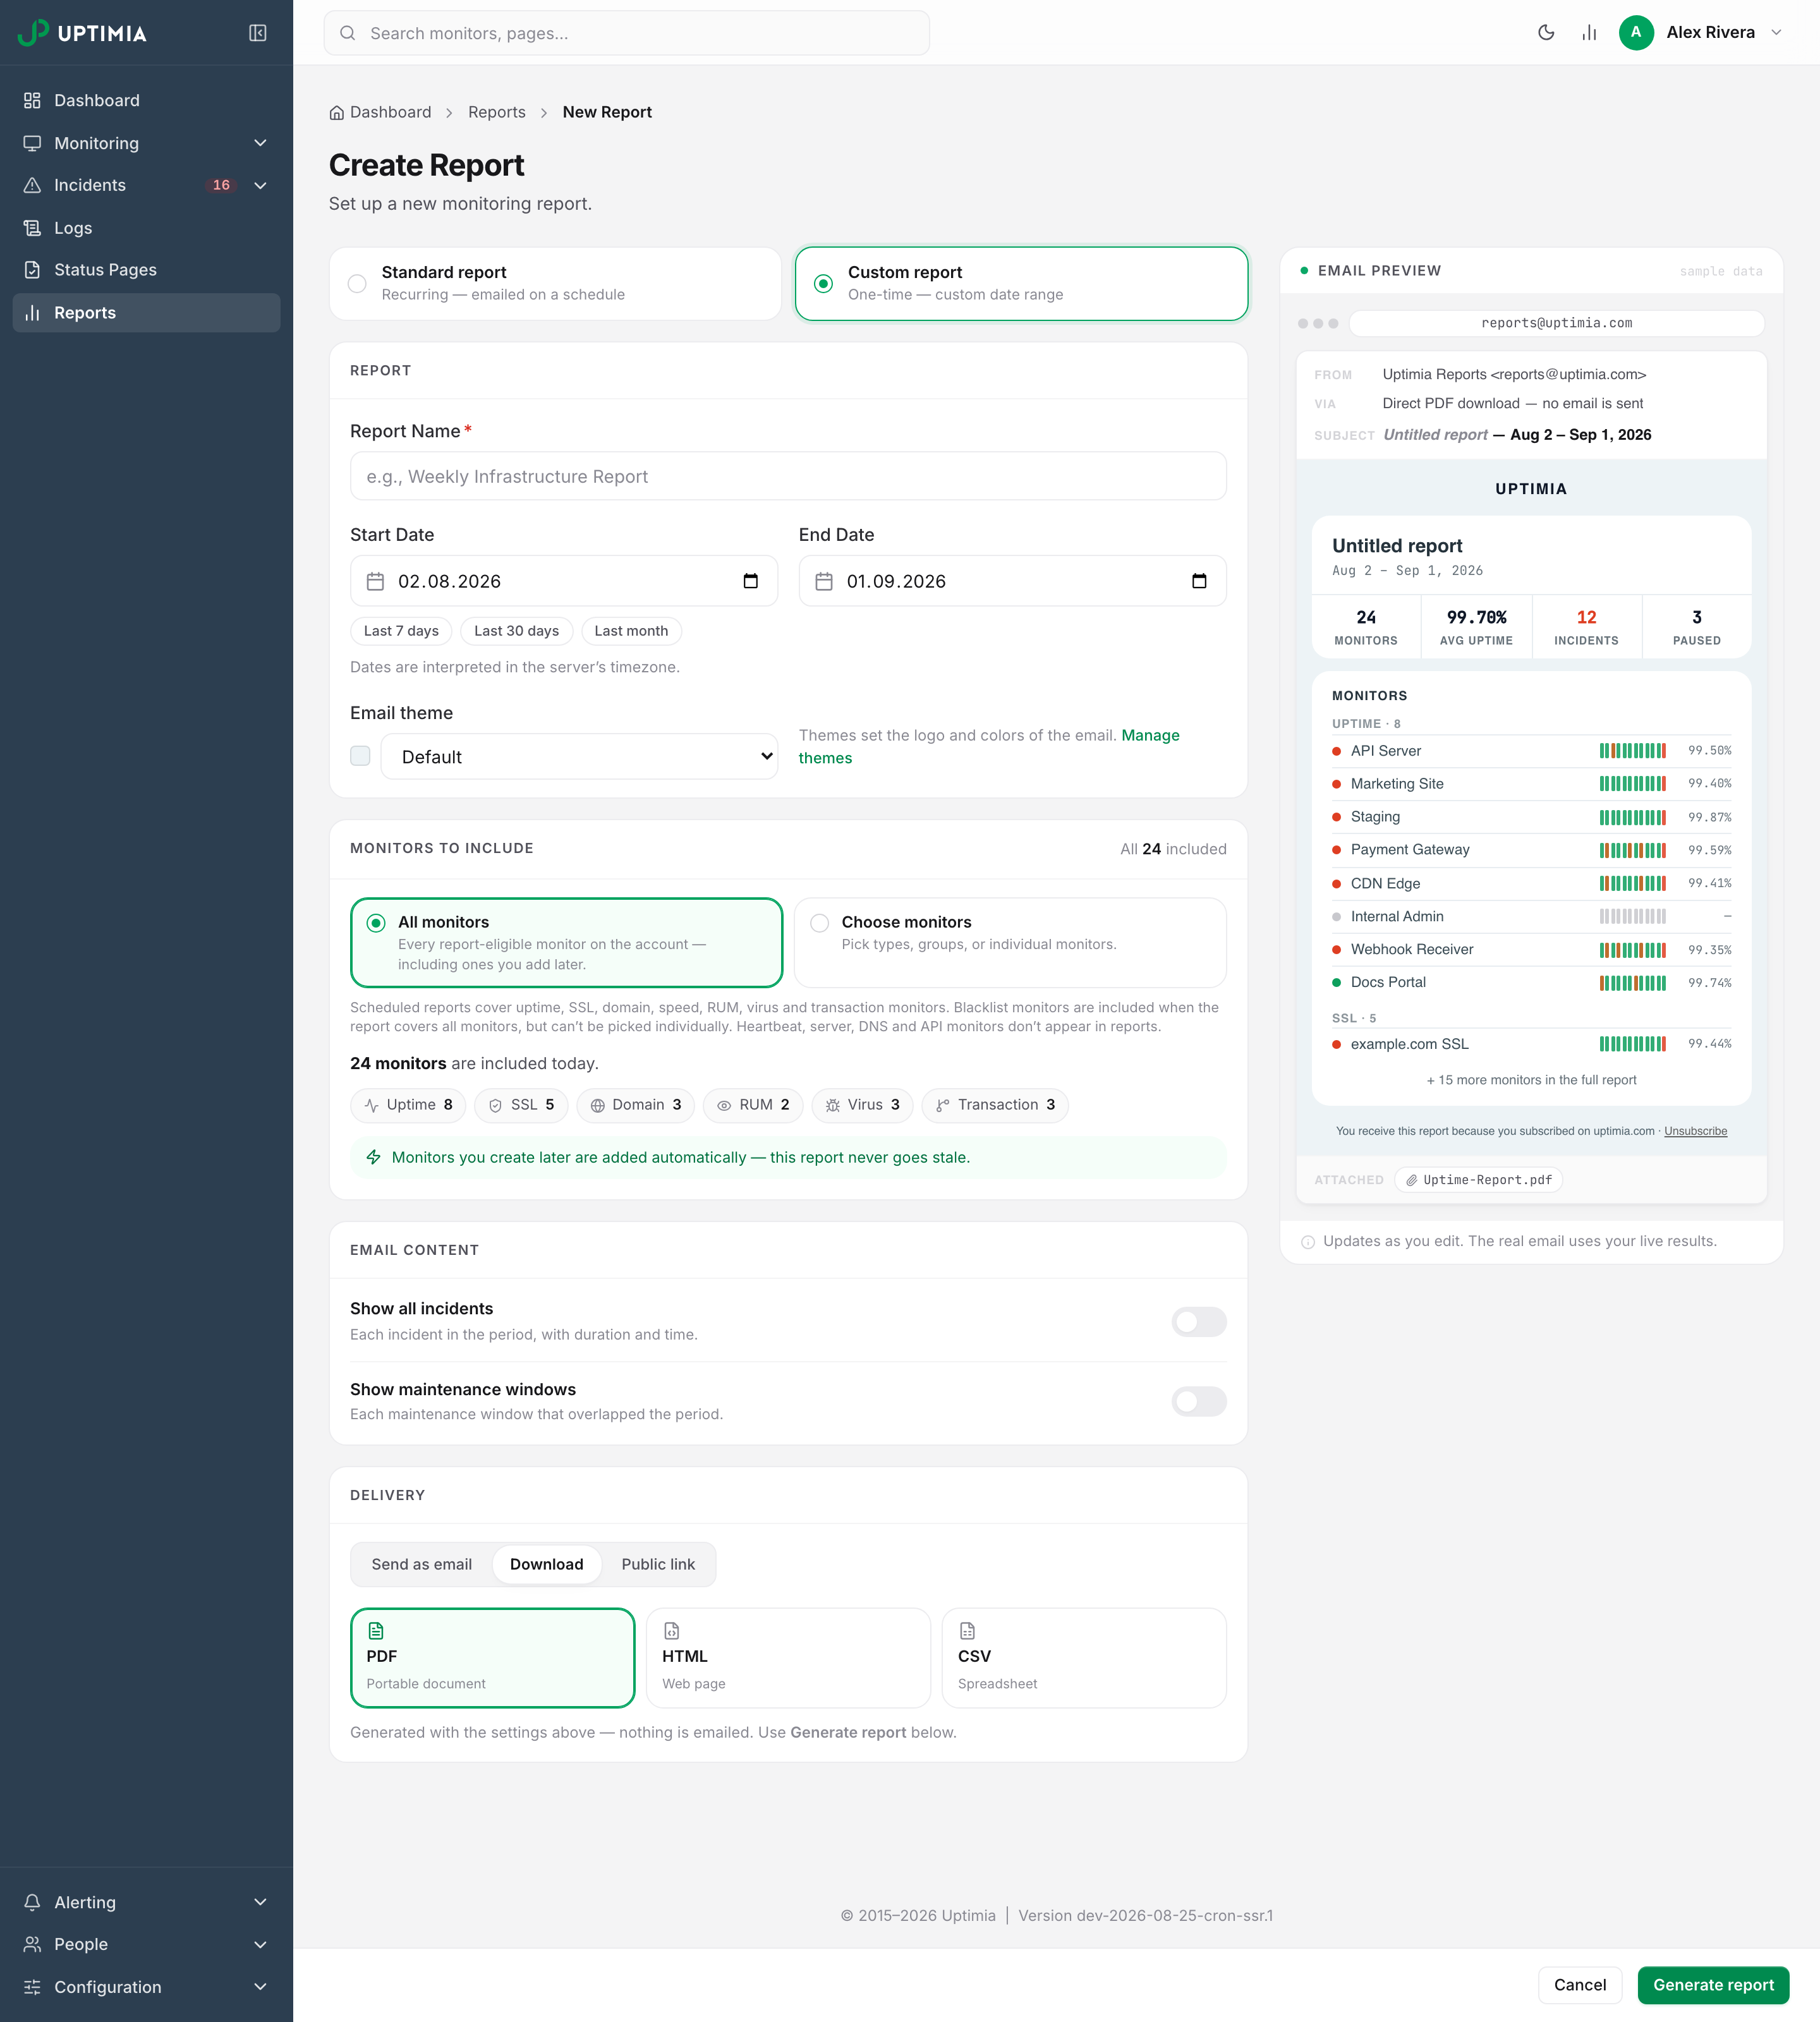
A custom report never carries attachments. Download in the Delivery card is how you get a file. It never appears in the Reports list either: Uptimia deletes it as soon as the report has been emailed, downloaded or published.
Managing Reports
The Reports page lists your recurring reports in a table:
| Column | What it shows |
|---|---|
| Name | The report name |
| Frequency | A badge: Daily, Weekly, Monthly, Quarterly or Yearly |
| Last Sent | When it last went out, or Never |
| Next Report | The next scheduled send |
Click a row to open the editor. On an account with no reports at all, an interactive explainer replaces the table and walks through what a report is.
The kebab menu on each row carries Edit, the three exports, Send Immediately, Create Public Link and Delete. In edit mode the save button reads Save Report.
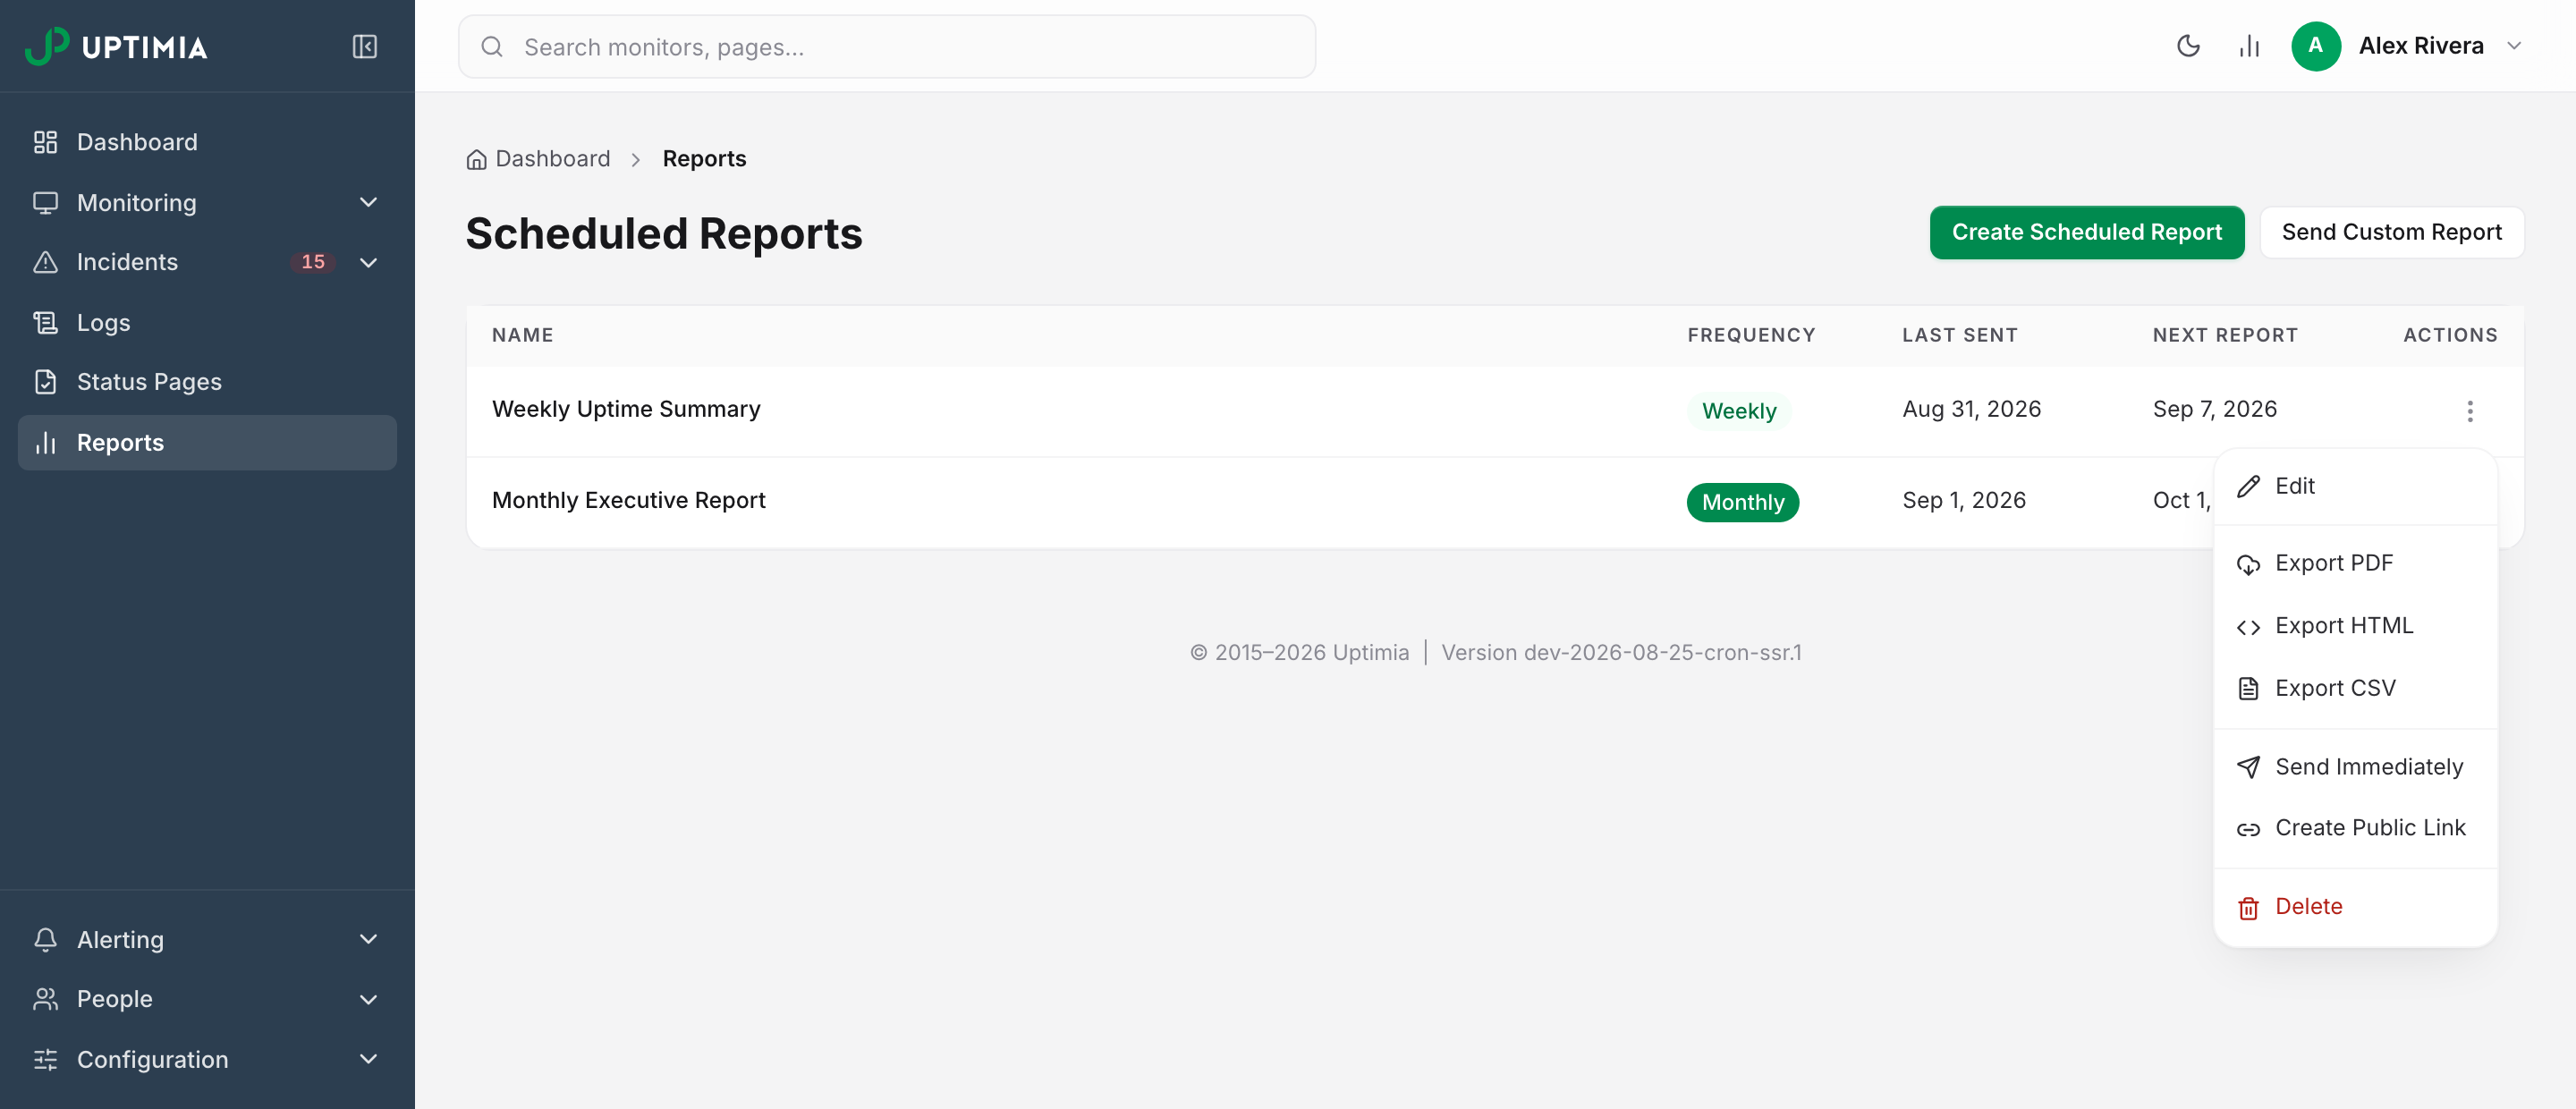
- Send Immediately builds and mails the report right now, honoring its configured attachments, and updates Last Sent. A confirmation shows how many emails went out.
- Export PDF / Export HTML / Export CSV generate the report on demand and download it. These are read-only and stay available to Read-only members.
- Delete stops all future sends. A confirmation modal appears first.
There is no report history view. Uptimia does not keep copies of reports it has sent.
Public Report Links
Create Public Link publishes a static HTML snapshot of the report and gives you a link like https://www.uptimia.com/reports/report-{date}{hash}.html. Anyone holding it can read the report without signing in; there is no password and no view limit.
Warning: A daily cleanup deletes public report snapshots once they are 30 days old. The link then stops working, with no warning in the control panel. When the recipient needs a durable copy for an auditor, a contract file or an SLA claim, send them the PDF or HTML export instead.
That 30-day sweep applies to report snapshots only. Public links for a single incident or a single check never expire; Exporting Your Data covers that difference.
Scoped Members and Reports
A member limited to specific monitor groups cannot create an account-wide report. All monitors is refused with the message "Your access is limited to specific monitor groups, so a report can't cover all monitors. Select the monitors you manage instead." A per-type auto-include rule is refused the same way, with the message "…so a report can't cover every monitor of a type. Select the monitors you manage instead." If a report covers monitors outside their groups, they cannot open, send, export or share it. The report shows as not found. That is how an out-of-scope monitor behaves everywhere else.
Reports and Stored History
A report summarizes the monitoring data still held for the period it covers, so a long cadence on a short-retention plan can reach past the data. Free accounts have 7 days of readable history, the trial 30, Basic 90, Professional 365 and Enterprise 730. Uptimia builds the report from the incidents still in storage, which usually holds a little more history than your plan promises. Data and Log Retention has the numbers. On a short-retention plan, keep the emailed PDF as the durable record.