
A single failed check does not open an incident. Uptimia re-checks from other probes first, and you set the threshold, per monitor, that decides how many must agree. That chain runs from the first failed check to the alert, and five links in it can absorb a real failure without paging you.
If you want fewer alerts rather than an explanation of where they come from, Getting Fewer, Better Alerts is the shorter read.
What Runs a Check
Six of the twelve monitor families let you choose which probes run the check. A probe is a server in one of Uptimia's monitoring locations that runs your check on a schedule and reports the result back. Those six are the only families with a Locations tab in the monitor editor:
| Family | Checked by |
|---|---|
| Uptime | Probes you select |
| SSL | Probes you select |
| Speed | Probes you select |
| Transaction | Probes you select |
| API | Probes you select |
| DNS | DNS-capable probes you select, rotating one per sweep |
| Domain | A lookup in the domain registry (WHOIS), with no location to choose |
| Virus | A Google Web Risk lookup |
| Blacklist | A sweep of public blocklist databases, with no location to choose |
| Heartbeat | Your own job, pinging the unique ping URL Uptimia gives the monitor |
| Server | An agent you install, reporting outward from your host |
| Real User | Your visitors' own browsers |
The probe-selection model covers those six families only. A heartbeat monitor has nothing to check from anywhere, because it waits for you. Where a family has no Locations tab, the 6-probe minimum, location profiles and probe-set edits do not apply to it.
Monitoring Locations and Coverage lists the locations in the network and what they can and cannot observe.
The 6-Probe Minimum
When a monitor uses Custom selection on its Locations tab, the selection must contain at least 6 probes. The editor counts for you. It shows "N of minimum 6 probes selected — pick M more" and blocks the save until you clear the floor.
Choosing All probes is exempt: it means every Uptimia location, including probes added later.
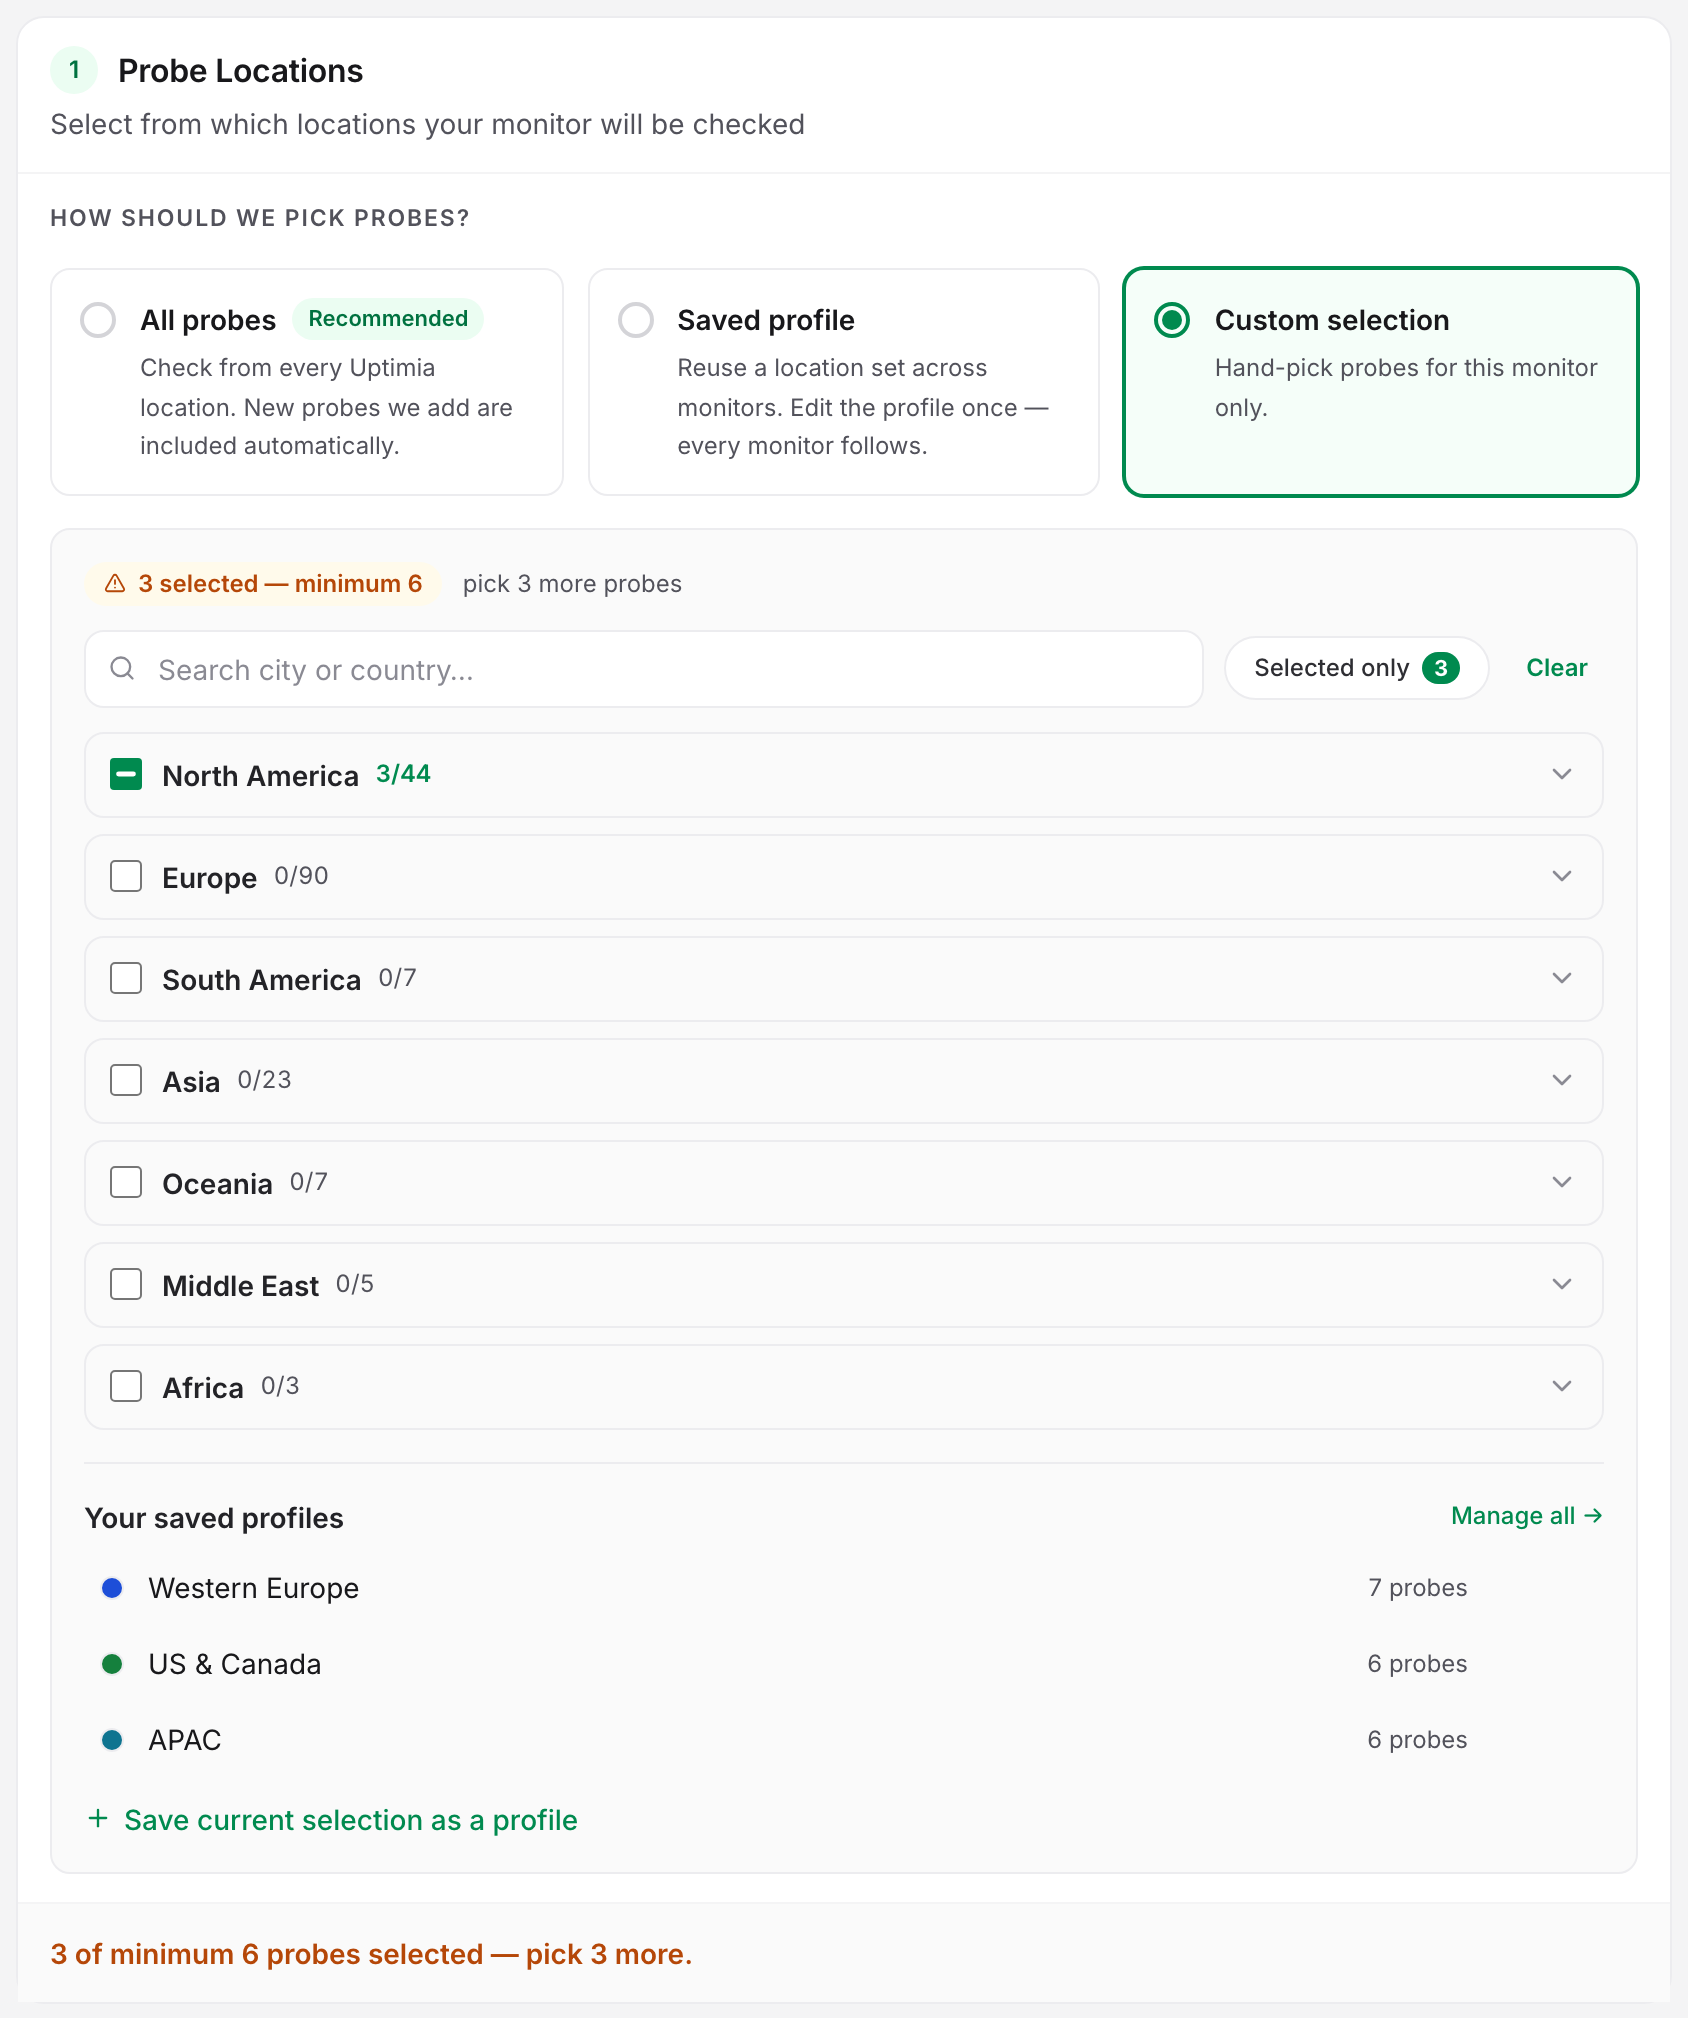
Confirming an outage takes up to 3 backup probes other than the one that raised the alarm.
DNS applies a second, stricter floor, counting only DNS-capable probes. A selection that clears the general floor can still be refused for a DNS monitor.
Outage Confirmation: How a Failure Becomes an Incident
When a probe reports a monitor down, Uptimia does not alert. It queues backup checks from other, distinct probes and waits for them. Once enough of them also report down, Uptimia confirms the outage: the incident opens and the alert clock starts.
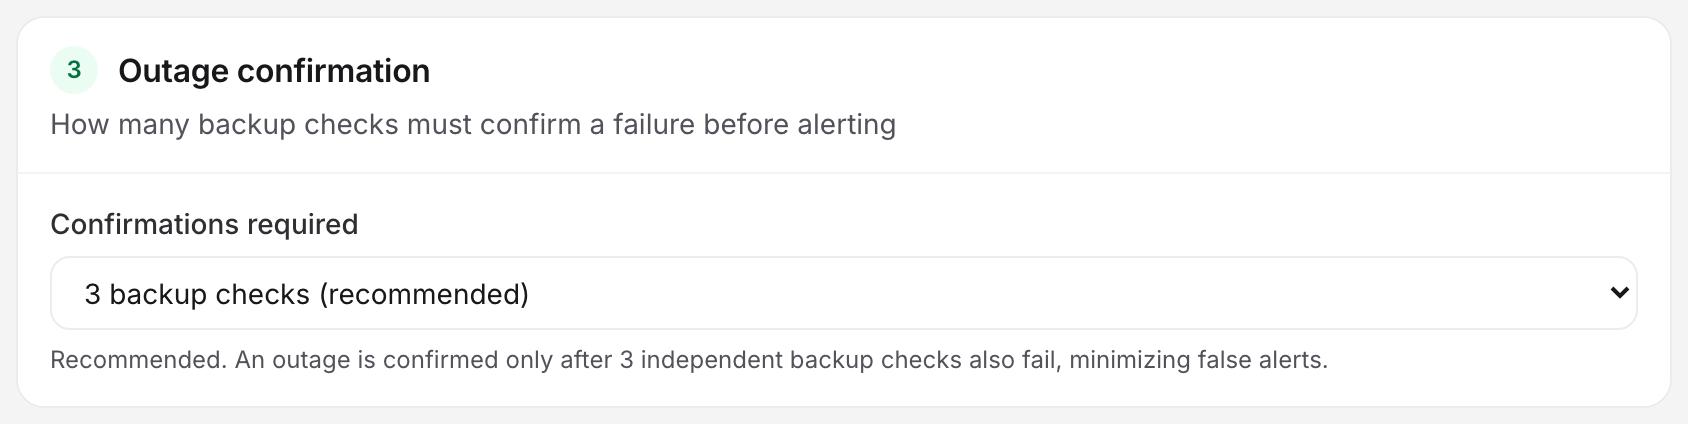
"Enough" is a number you set. Outage confirmation is a per-monitor control on the editor's Advanced tab. Its one field, Confirmations required, takes 3, 2 or 1, and 3 is both the default and the recommendation. You get it on every account and every plan.
| Confirmations required | What it means | Trade-off |
|---|---|---|
| 3 (default) | An outage is confirmed only after 3 independent backup checks also fail | Slowest to page, fewest false alerts |
| 2 | 2 backup checks must fail | Faster, one more chance of a false alert |
| 1 | 1 backup check must fail | Fastest, and one flaky probe can raise a false alert |
Uptimia queues exactly the number of backup checks you asked for: a monitor set to 1 runs 1 backup check, never 3. Confirmation counts distinct probes rather than rows, so one probe answering twice never satisfies a threshold of 2 on its own. 3 is the highest you can set, because there are only 3 backup-probe slots.
Which Families Have This Control
Uptimia offers outage confirmation for Uptime, SSL, Speed, Domain, Transaction, API and DNS. Real User and Server monitors have no backup-check mechanism, so they carry no such setting. Virus, Blacklist and Heartbeat do not use one either.
Those seven count in three different ways, and the editor words the control accordingly:
- Uptime, SSL, Speed, Domain and Transaction count additional probes. Confirmation excludes the probe that raised the alarm, so 3 means 3 more opinions on top of the first failure.
- API counts total failing observations, the primary run included. At 1, the first failed run opens the incident with no second opinion.
- DNS counts other probes that re-sweep the zone and see the same change. At 1, Uptimia skips the confirming round and the first sweep pages on its own.
Recovery Is Deliberately Asymmetric
A single backup check reporting "up" recovers the monitor, whatever the threshold is set to. Lowering Confirmations required only speeds up how fast a monitor goes down. It never changes how it comes back.
From Confirmed Incident to Alert
Two settings decide timing, and they sit together in the Notification Settings card on the editor's Main tab.
| Setting | What it does | Default | Range |
|---|---|---|---|
| Check frequency | How often the check runs. On an uptime monitor the slider reads back as "Check for problems every 5 minutes" | 5 minutes on an uptime monitor (Speed 10 minutes, SSL and Transaction 30 minutes, API 5 minutes, Domain every 7 days, Virus daily) | 30 seconds to 24 hours, floored by your plan and family |
| Alert delay | How long a confirmed problem must persist before the alert is sent. Reads back as "Notify after 5 minutes when problems occur" | 5 minutes | 0–30 minutes |
The fastest cadence you can select depends on the plan and on the family.
| Family | Fastest cadence |
|---|---|
| Uptime | 5 minutes on Free, 1 minute on Basic, 30 seconds on Professional, Enterprise and the trial |
| Speed | 5 minutes on Free and Basic, 30 seconds on Professional, Enterprise and the trial |
| API | 5 minutes on Free, 1 minute on every other plan; never faster than 1 minute |
| Transaction and SSL | 10 minutes |
| Domain | Days |
| Virus | Hours |
| DNS | No slider; sweeps every 5 minutes |
On an uptime monitor, the slider's steps get coarser above the per-minute range, up to a maximum of 24 hours. See Plan Limits and Quotas.
Alert delay is a grace period on a confirmed incident. If the monitor recovers before the delay elapses, Uptimia cancels the queued alert and sends nothing, which is how a short flap is suppressed. The incident is still recorded.
Four families have no alert-delay slider, because their timing is governed elsewhere: Real User, Heartbeat, Blacklist and DNS. A heartbeat monitor's grace period sits on the Schedule card.
When an Escalation Policy Is Attached
Attaching an escalation policy does not remove the alert delay. It re-uses it. The moment the incident is confirmed and the alert delay has elapsed is t+0: the ladder's first step fires then, and every wait between steps counts from there. A step that reaches nobody does not consume its wait.
The monitor's own recipient list is still required and still live in this mode, and it is the fallback when the grouping and escalation layers cannot take an incident. If a whole ladder completes without reaching anyone, Uptimia pages the account owner as a last resort. See Who Gets Alerted.
Why a Real Failure Can Produce No Alert
Five mechanisms suppress an alert.
- A single probe's transient error, contradicted by the others. One backup check reporting "up" recovers the monitor. If one location briefly cannot reach your site while the rest load it fine, blame that probe's network path before your site.
- Recovery inside the alert delay. A confirmed incident that clears before the delay elapses has its queued alert canceled.
- The monitor is in a maintenance window. Uptimia drops a result that arrives while a monitor is in maintenance. The result stays out of the log, opens no incident and fires no alert. The same is true for a paused or suspended monitor. See Maintenance Windows.
- The recipient's alerting schedule is closed. The alert delay is only a floor. Uptimia does not drop an alert that comes due outside a recipient's alerting window; it holds the alert and delivers it when the window opens. You get the "was down / recovered" pair when you come back on. A recipient with all 7 days blocked is never paged. See Alerting Schedules, Quiet Hours and Time Zones.
- Someone acknowledged it. Acknowledging an alert group pauses its escalation ladder without closing the incident, so the later steps you were expecting do not fire. They fire again only if the account has set If still down after acknowledgement to 30 min, 1 h or 2 h. That restarts the paused ladder. See Acknowledging Incidents and MTTA.
A sixth case is a blind spot rather than a suppression. An uptime check confirms that a page responds and says nothing about whether your application is behaving. A page can return HTTP 200 while rendering an error. Turn on Check if a specific content is on your website on the Main tab. The check then fails when expected text is missing or unexpected text appears. Why Didn't Uptimia Detect My Outage? works through that case.
What Probes Can and Cannot See
Uptimia's probes run from datacenter IP addresses and behave like a server-to-server request. They cannot see a block that applies only to consumer connections. If one residential ISP blackholes your site while datacenters reach it, no monitor will report downtime.
Real User Monitoring (RUM) narrows that gap by collecting load timings from your visitors' own browsers on their own networks. Run it alongside probe-based monitoring, not instead of it. RUM only reports on traffic you already have, so it cannot tell you that a page nobody visited went down.
The same datacenter origin is why a WAF, bot manager or geo rule can make a healthy site look down to Uptimia and only to Uptimia.