
A false positive is an alert that does not match what you see in your browser. The site is clearly up, but a site-down alert arrives; the certificate and content are fine, but an SSL-invalid or keyword-not-found alert fires; or a down-and-up pair clears within a minute. Nearly all have one of two causes. Most come from a WAF, a bot manager, a CDN rule or a geo-block that treats Uptimia's probes differently from your visitors. The rest come from a confirmation threshold someone lowered. If your alerts are correct and there are too many of them, read Getting Fewer, Better Alerts instead.
First, Check the Outage Confirmation Threshold
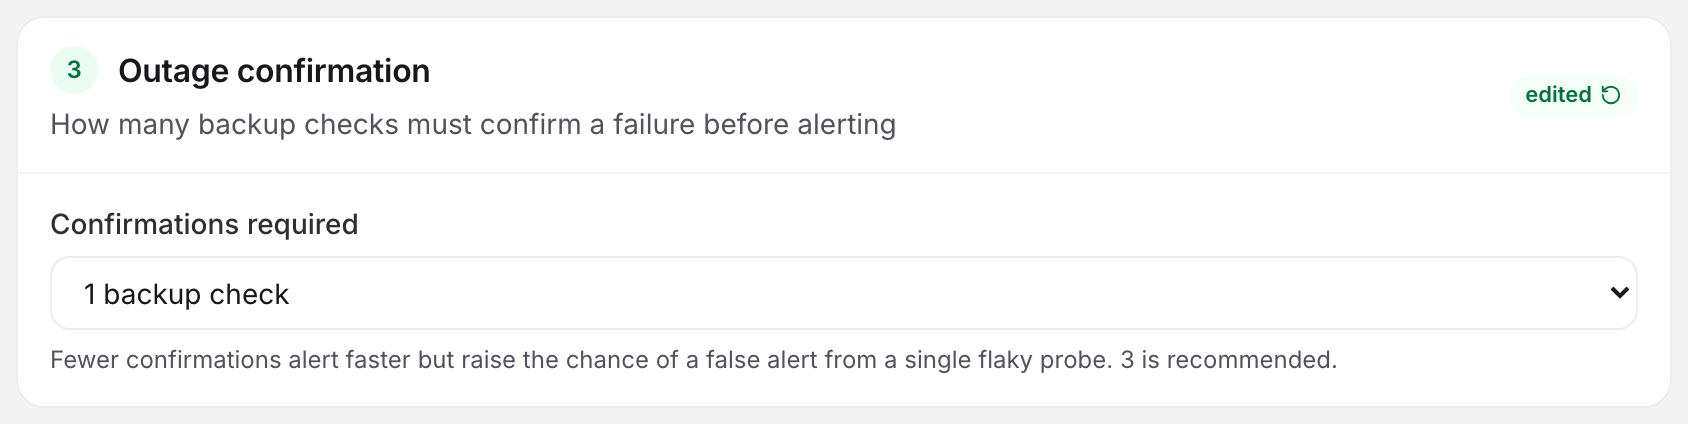
Uptimia does not alert on the first failing check. When a probe reports a monitor down, Uptimia dispatches backup checks from other probes, and the incident opens only once enough of those backup checks agree. How many is a per-monitor setting. A monitor someone lowered to 1 opens the incident as soon as one backup probe agrees. That is two failing checks instead of four, which is often all a single transient blip needs to page you. On API and DNS monitors a value of 1 is faster still: the first failed run or sweep alerts on its own.
Open the monitor editor and go to the Advanced tab. Read Outage confirmation → Confirmations required. The range is 1–3, the default and recommended value is 3, and the card is available on every account and every plan, for uptime, SSL, Speed, Domain, Transaction, API and DNS monitors.
If it reads 1, that is your first suspect. Set it back to 3. That slows down-confirmation and nothing else. Recovery stays asymmetric, so one "up" result recovers the monitor whatever the threshold is; what each value counts, and why API and DNS monitors count differently from the rest, is in How Uptimia Monitoring Works.
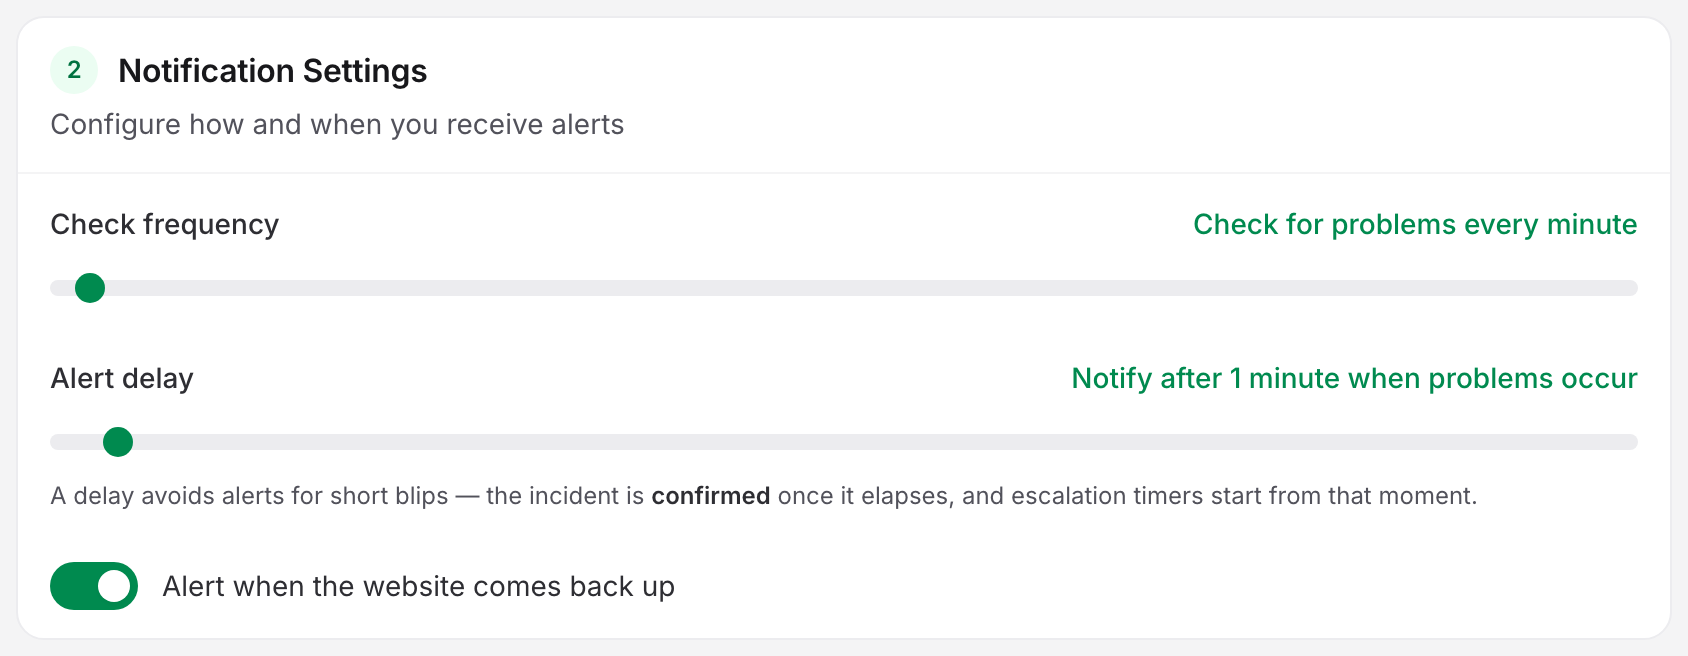
The other timing control is Alert delay, on the Main tab in the Notification Settings card: a 0–30 minute grace period, default 5 minutes, after which the incident is confirmed. The hint spells it out: "A delay avoids alerts for short blips — the incident is confirmed once it elapses." On a monitor using an escalation policy the same hint adds ", and escalation timers start from that moment." The slider reads back as "Instantly notify when problems occur" at 0 and "Notify after 5 minutes when problems occur" above it. If the monitor recovers inside that delay, Uptimia deletes the pending alert and sends nothing. That absorbs most isolated blips.
A CDN, WAF or Bot Manager Is Blocking the Probes
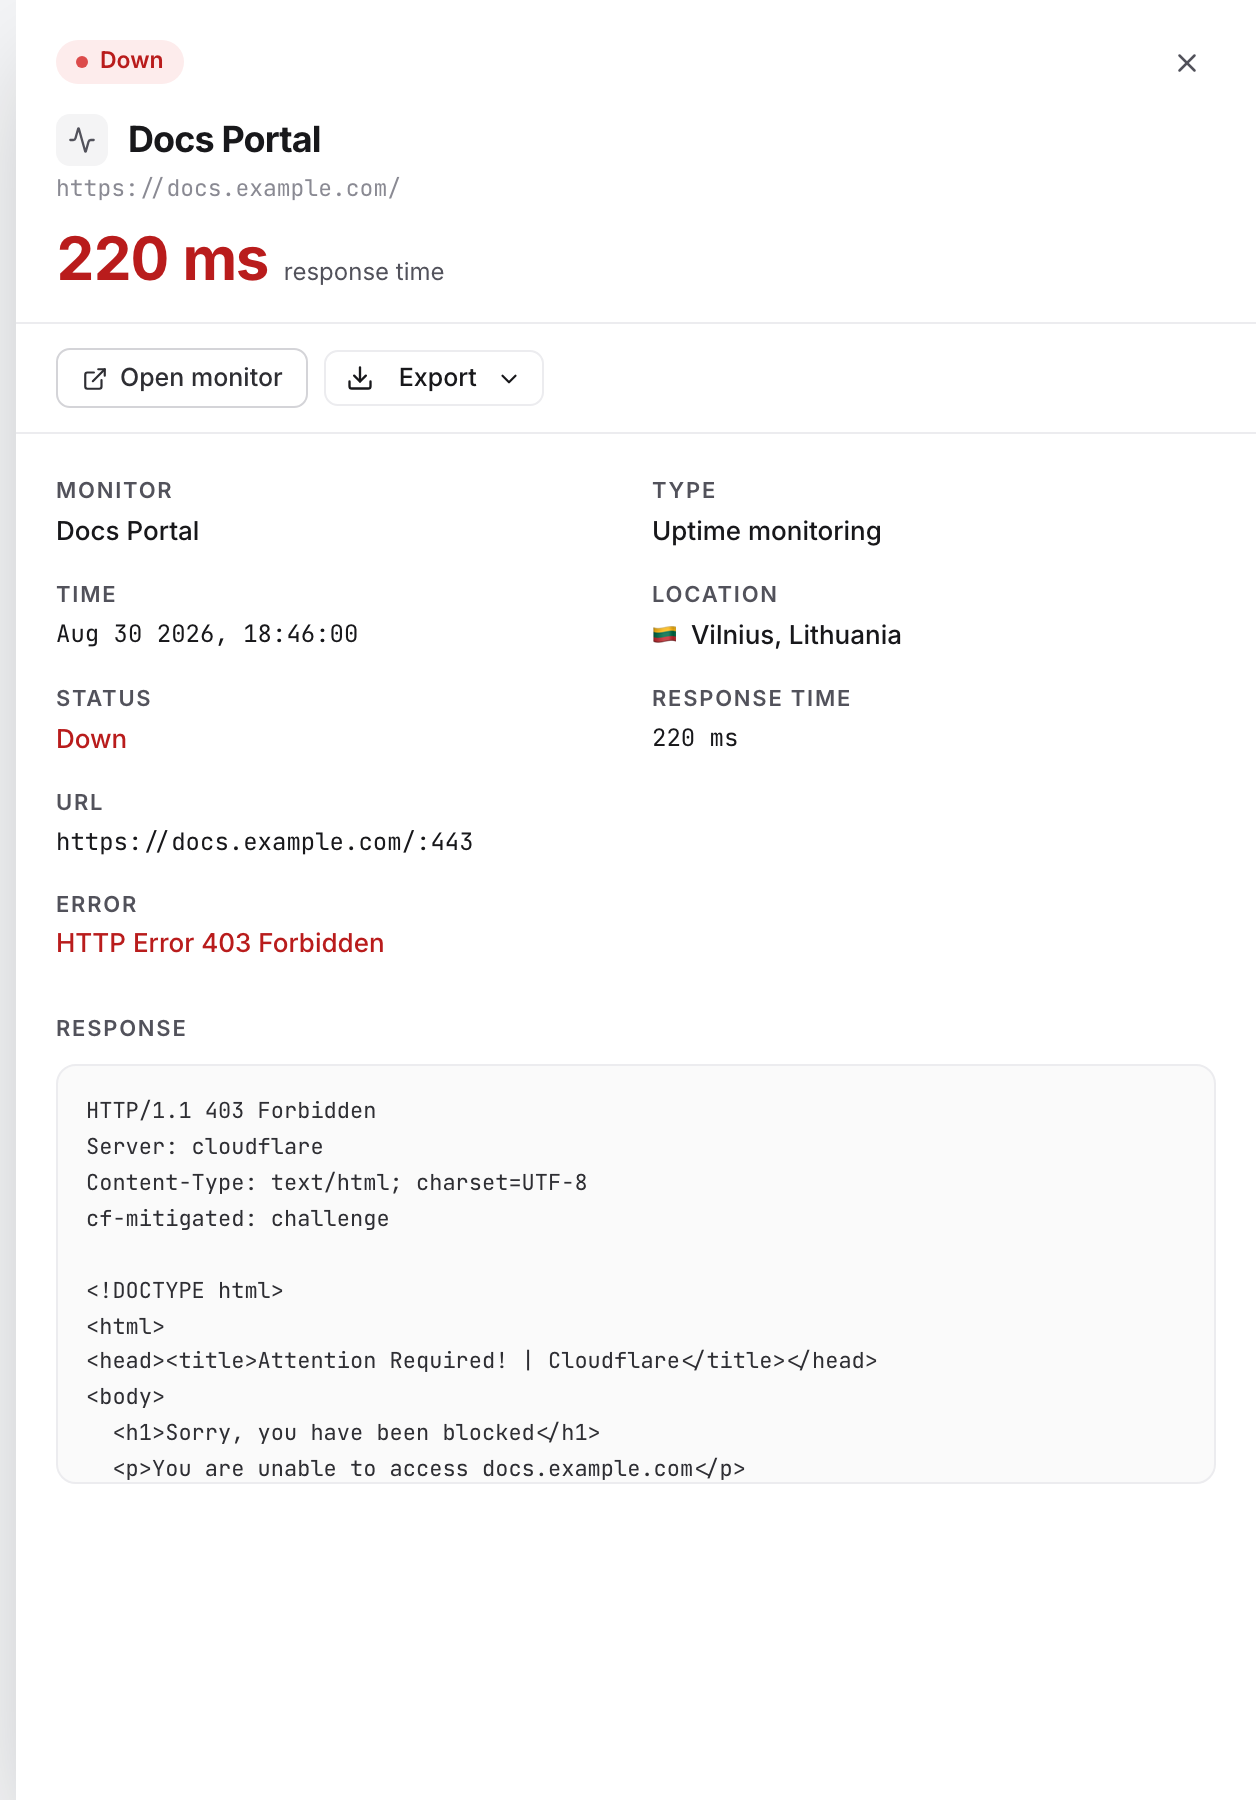
This is the most common cause. Uptimia's probes connect from datacenter IP addresses, never residential ones, and security tooling is built to treat datacenter traffic as suspicious. A WAF, bot manager, rate limiter or CDN rule can block the probe, return a challenge page, or serve an error. Your visitors browse from residential networks and are unaffected, so the site looks up to you while the probes are blocked; customers describe this as alerts "every 5 minutes" or "all night while the site was up".
Check: open the failing check and read what the probe received. On the monitor page, the Check log card lists the last checks in When, Result, Location and Response time columns; click a row to see the Error for that one check. A 403, a short unexpected body, or a challenge page is the signature. For a wider view use View all logs, which opens Monitoring Logs pre-filtered to this monitor.
Fix: allowlist the probes at every layer that inspects the request: firewall, WAF, CDN and antispam. The procedure and the current addresses are in Whitelisting Uptimia's Probe IPs.
Include IPv6. As of August 2026, IPv6 is published on 95 probes; the rest are IPv4-only. For those 95, an IPv4-only allowlist silently misses every check that arrives over IPv6. An IPv6-aware security layer such as Akamai Bot Manager keeps blocking those checks.
Allow, do not merely rate-limit. A generic "block hosting providers" rule, or any rule that blocks a whole hosting network, catches the probes. The explicit allow or skip rule has to take precedence over those broad blocks.
Allowlist by User-Agent when addresses are impractical. Every probe request identifies itself. Plain HTTP uptime checks send:
Mozilla/5.0 (compatible; Uptimia; www.uptimia.com)
Browser-driven checks (Speed and Transaction) send a desktop Chrome User-Agent ending in:
Uptimia/1.0 (https://www.uptimia.com)
That User-Agent causes false positives as often as it fixes them. F5 BIG-IP ASM, Akamai, Imperva and Cloudflare have rules that block a request because the browser version in its User-Agent looks too old. A browser-driven check that trips one gets back a block page of a few hundred bytes containing none of your content, and the monitor then reports the site down, or your keyword missing, with no other symptom. If you run a minimum-browser-version rule, exempt Uptimia's probes from it.
Cloudflare
A clean Security Events log does not rule Cloudflare out. A Managed Challenge, a JS challenge, "I'm Under Attack" mode or Bot Fight Mode can show a challenge page to automated clients only. The probe then receives a 403 or a challenge HTML page instead of your content, and it may not appear as a hard block.
Add the probe addresses to an IP Access Rule with the Allow action, then add a WAF custom rule that skips managed rules, bot detection and rate limiting for that traffic. Uptimia checks the public, proxied URL, so every edge rule applies to the probes.
Akamai and Other Bot Managers
Akamai Bot Manager scores datacenter addresses aggressively and is IPv6-aware. Add the probes to the allow or bypass list for IPv4 and IPv6, and exempt them from bot-category actions. The pattern is the same on Imperva, AWS WAF and Fastly: an explicit exception for the probe ranges, ordered before your bot and datacenter blocks.
A Probe Region Is Geo-Blocked or Geolocated Wrongly
If your service restricts traffic from certain countries, probes in those regions see the block, and that can open a down alert your audience never experienced. A third-party geo-IP database can also place a probe's address in a neighboring country, such as a UK probe registering as Luxembourg. That trips a geo-rule unexpectedly.
Fix, on the monitor's Locations tab. The tab opens with How should we pick probes? and three choices: All probes (the default, and new probes join automatically), Saved profile, and Custom selection. Pick Custom selection and choose probes in the regions you serve. As you tick, a live counter tracks the floor: "3 of minimum 6 probes selected — pick 3 more." It turns red after a blocked save.
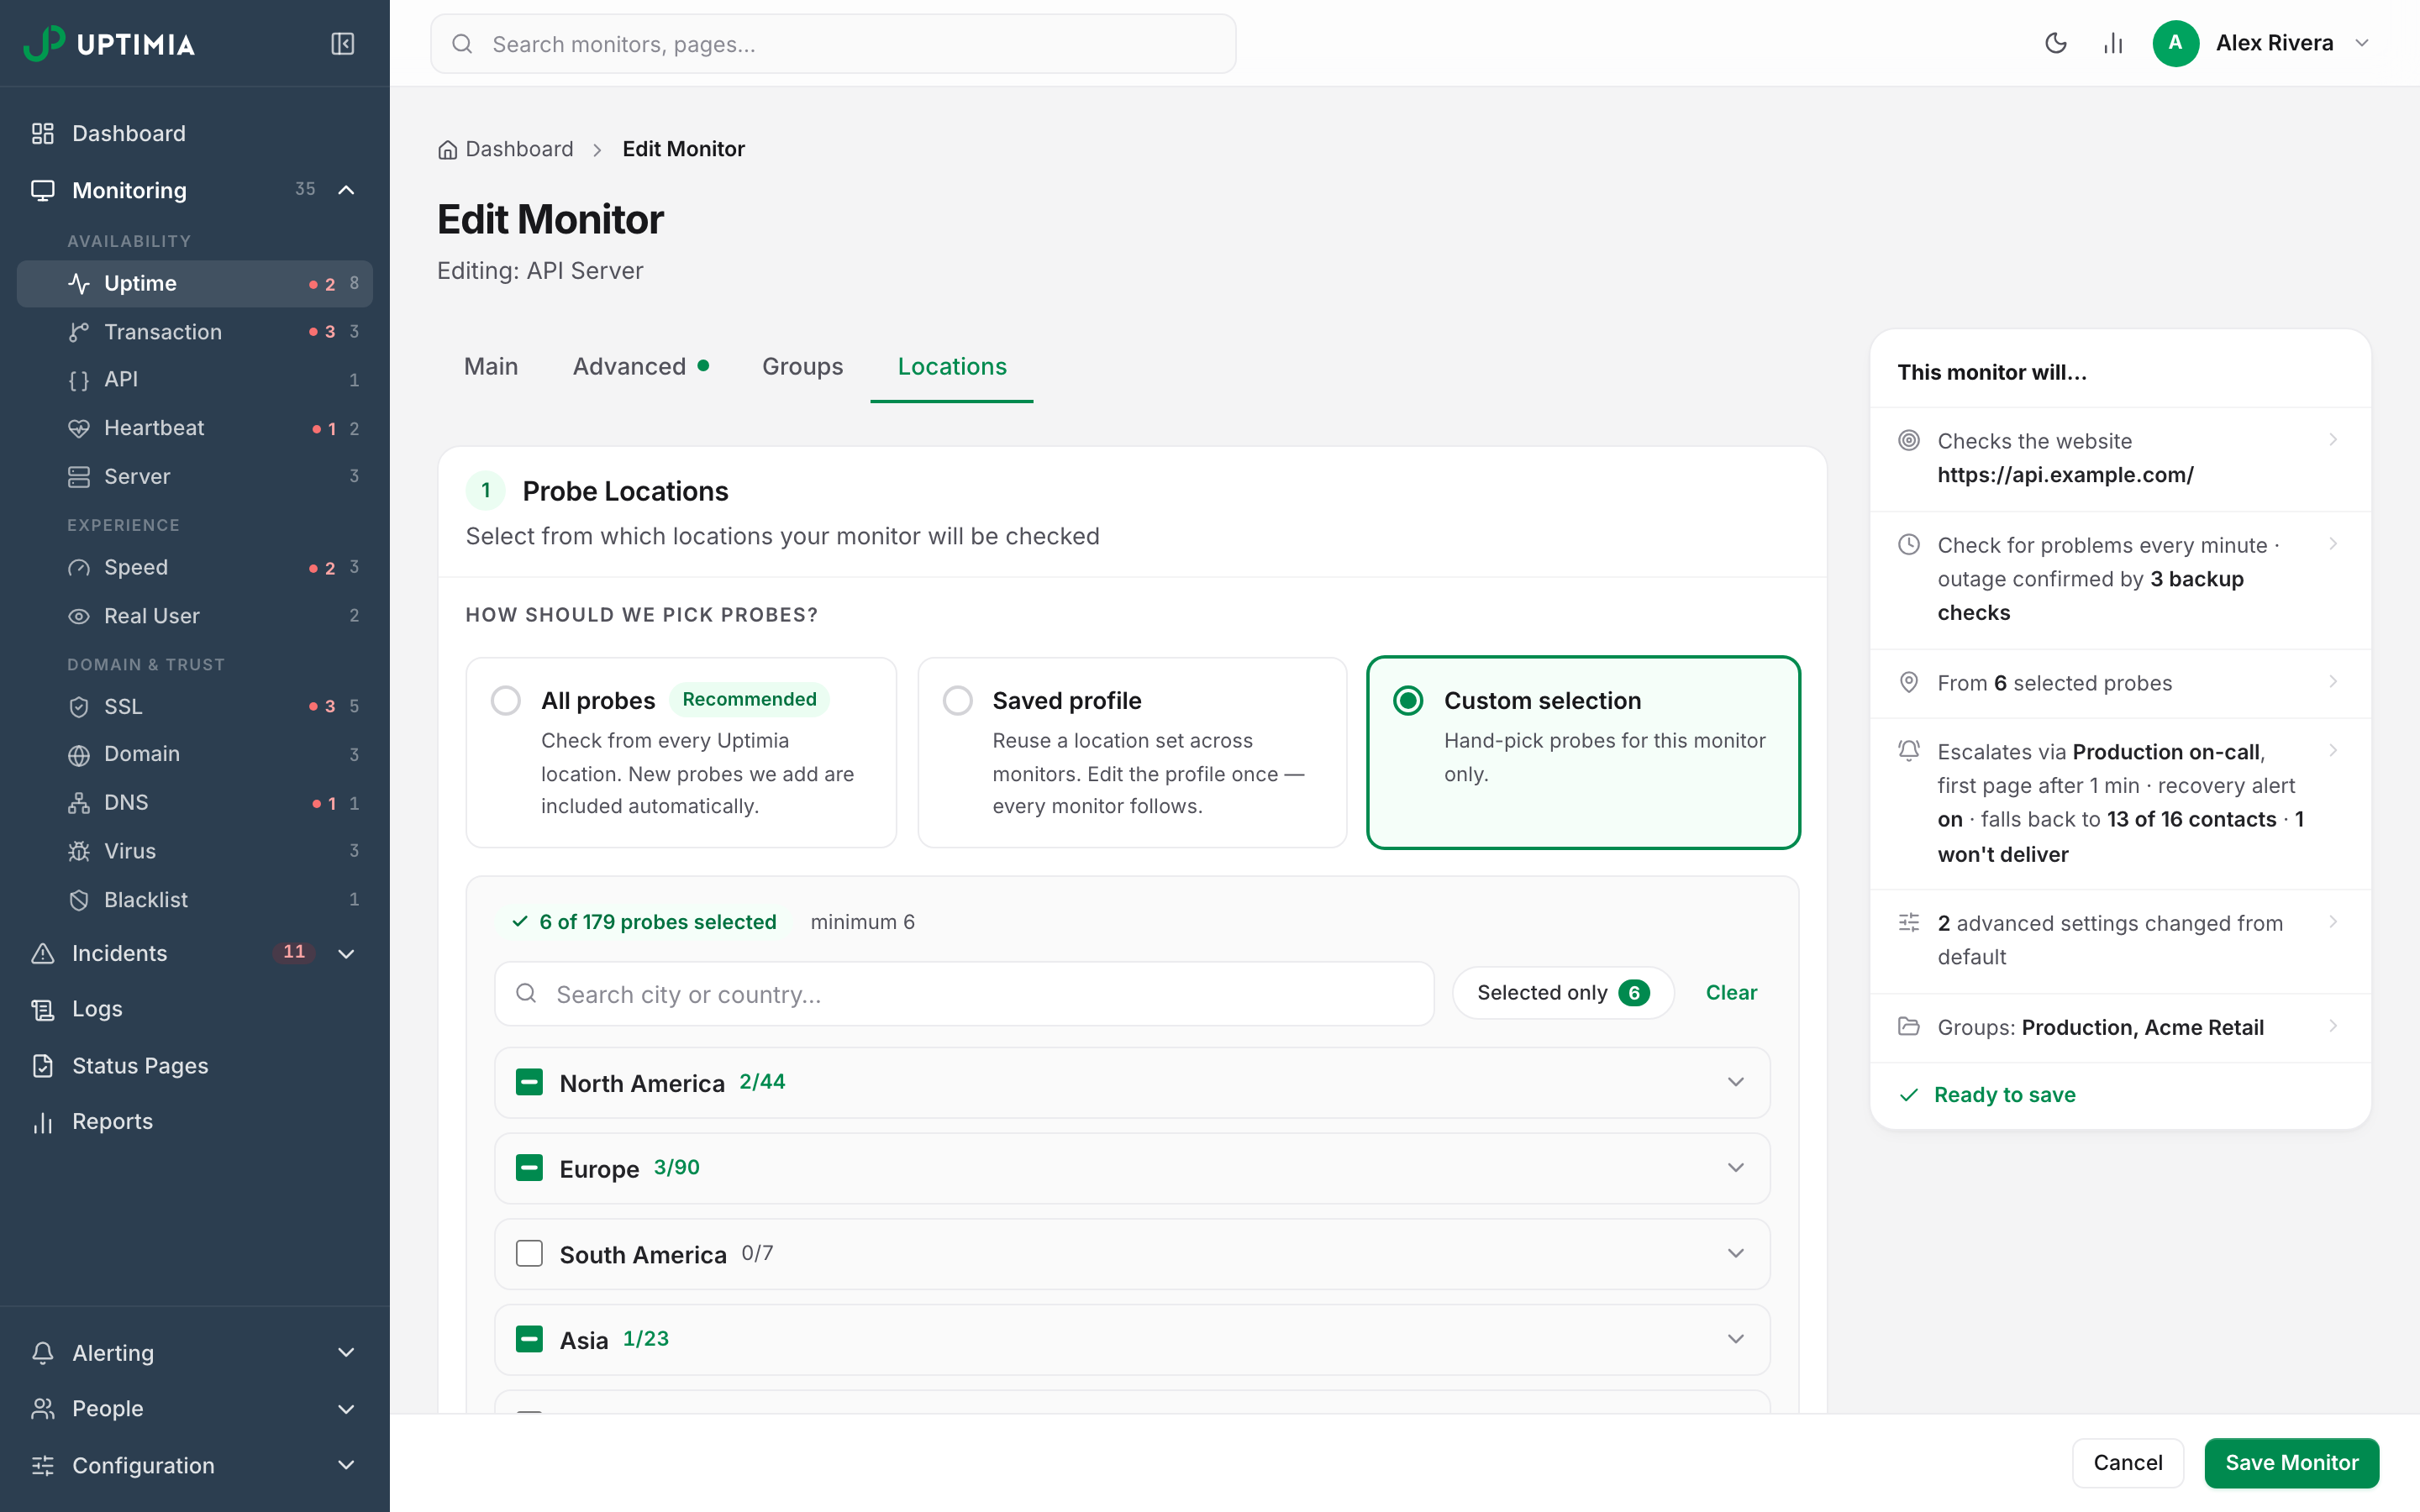
Six selected locations are not always six machines. As of August 2026 the catalog lists 179 selectable locations running on 138 probe machines: Washington D.C. runs on the New York City host, Boston and Newark on New Jersey, and Las Vegas, Baltimore and Cleveland on Los Angeles. Spread the selection across distinct cities. If you are picking for more than one monitor, save the set once as a location profile and apply it.
An IP allowlist overrides a country block, however the address geolocates. If your service is region-locked on purpose, allowlist instead of dropping probes.
Empty Responses, Edge-Cache Misses and Transient Blips
One empty response, a CDN edge that returns a brief error, or a short network problem at one datacenter can all trigger a down or slow-load alert. The monitor then recovers within a minute. Confirmation catches most of these; a tightly correlated blip can still get through.
Check: open the incident from the monitor's Incidents card. Its opening timeline entry states the error and, where more than one probe agreed, adds "confirmed by N checkpoints", which tells you whether one probe saw the error or several did without opening the log for each location. The stat strip shows Alerts sent. The Timeline card lists which contacts received which alerts and when. If the same single location keeps appearing, suspect the route to that probe, not your site.
Fix: raise Alert delay to absorb blips that recover inside it, and schedule a maintenance window over known-noisy periods such as deploys and backups. Uptimia drops those results as soon as they arrive, so nothing is logged and nothing alerts.
Keyword or SSL Checks Misreading Dynamic Content
A keyword-not-found alert can fire while you can see the text on the page. Three causes account for most of them:
- JavaScript injects the keyword after load, so it never reaches the probe.
- The probe received a cached or challenge page that does not contain the keyword.
- The match string differs from the served HTML by whitespace, casing or an HTML entity.
Choose a string the server returns in the raw HTML, keep it short and stable, and avoid text that changes per request. For an SSL-invalid alert, confirm your server sends the full certificate chain including intermediates. A browser will often fill a missing intermediate from cache; a probe will not.
Alerts Kept Arriving All Night
If the monitor is attached to an escalation policy, the ladder keeps paging until someone takes it. Acknowledging the incident holds the pending steps and the repeat rounds, by default until the incident closes or someone un-acknowledges it; do it in the control panel, or through the signed link in the alert itself, which needs no login. An account can set that hold to expire after 30, 60 or 120 minutes, after which the ladder resumes on its own. See Acknowledging Incidents and MTTA.
If the hours are the problem rather than the incident, set quiet hours on the recipient instead of muting the monitor: Uptimia holds an out-of-window alert and delivers it when the window opens. Nothing is dropped, so you still get the record. See Alerting Schedules, Quiet Hours and Time Zones.
When to Contact Support
If you have allowlisted the current probe addresses over IPv4 and IPv6 and the alerts continue, send Uptimia support:
- The monitor name and its URL or host.
- The incident timestamp, in a named time zone.
- Which probe locations fired, from the Check log card or Monitoring Logs.
- The exact Error text on one failing check.
That lets support compare the probe's request against your server and CDN logs for the same second, and rule out a probe-side fault.