
A failed transaction check stops at the step it could not complete, and the incident then reads Transaction error — Error on step #N. Almost every cause of that failure is visible in the screenshot the step stored, which shows what the browser saw at the moment the step ran. Start there. For the authoring habits that prevent failures, see Writing Stable Transaction Checks.
First, Confirm the Monitor Is Not Suspended
A suspended monitor stops running checks. No amount of flow-fixing restores it.
Cause. Suspension follows your plan count. Failed checks never trigger it. Uptimia sets it when your plan is recounted (after a downgrade, an expired subscription or a reactivation) and the account holds more monitors than the new plan allows. Transaction monitors share one Advanced checks pool with Speed monitors, and Uptimia re-enables Speed monitors first. A plan with 10 advanced checks and 10 Speed monitors leaves nothing for transactions. Within each family Uptimia keeps the oldest monitors and suspends the rest.
Check. Open the monitor. The header status badge and the Current Status cell of the stat strip both read Suspended. Then open the avatar menu (top right) → Plans & Billing and read the Advanced checks row, which shows used against limit for Speed and Transaction together. Roles without billing access get the same figures from the Usage button in the top bar, which opens Plan Usage. The row there is labeled Advanced Monitors.
Fix. Delete a Speed or Transaction monitor you no longer need, or move to a plan with a larger pool. The pool is Free 0, Basic 1, Professional 10, Enterprise 100, and 50 on the trial. See Plan Limits and Quotas. Creating a monitor beyond the pool is refused with "You have exceeded the maximum number of monitored sites", so a monitor you just created is never suspended.
Where to Read the Failure
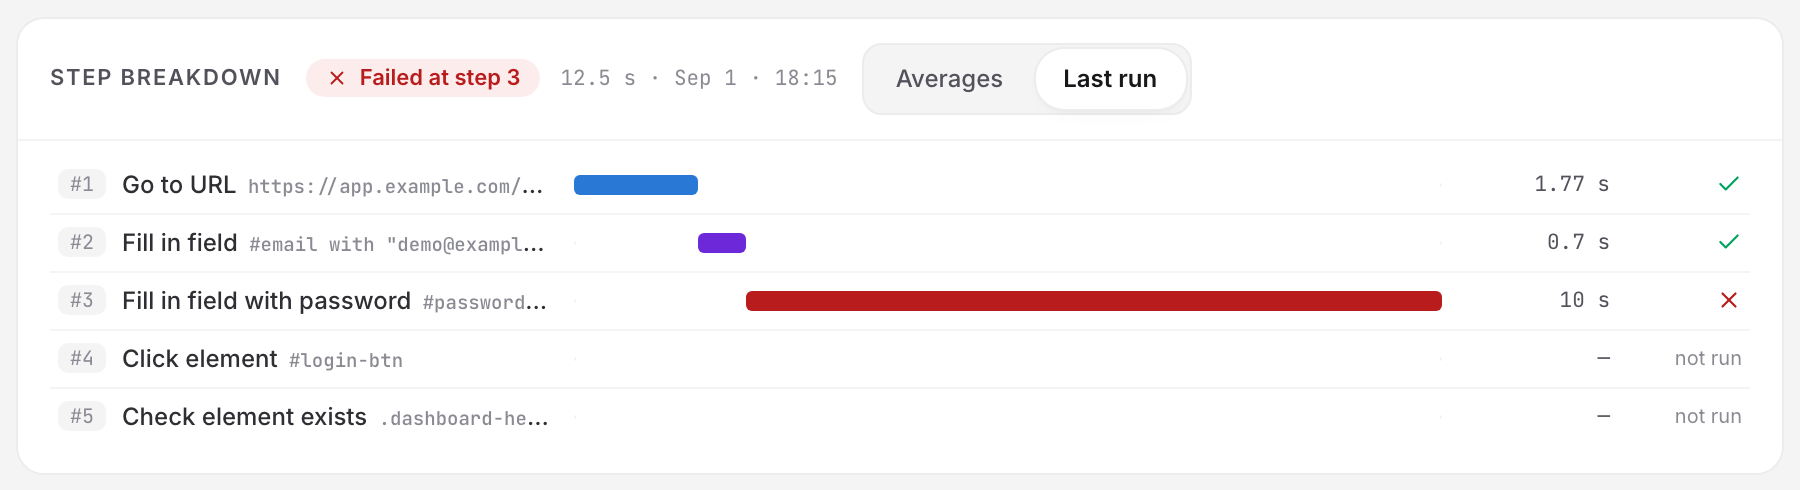
The monitor page, for the most recent run. The Step breakdown card has an Averages / Last run switch, and in Last run each step becomes a waterfall bar, the failed one red, with any step the run never reached marked not run. Any row whose step stored a screenshot has a camera button. Click it to open the screenshot. The card header carries the verdict: All N steps passed, or Failed at step N.
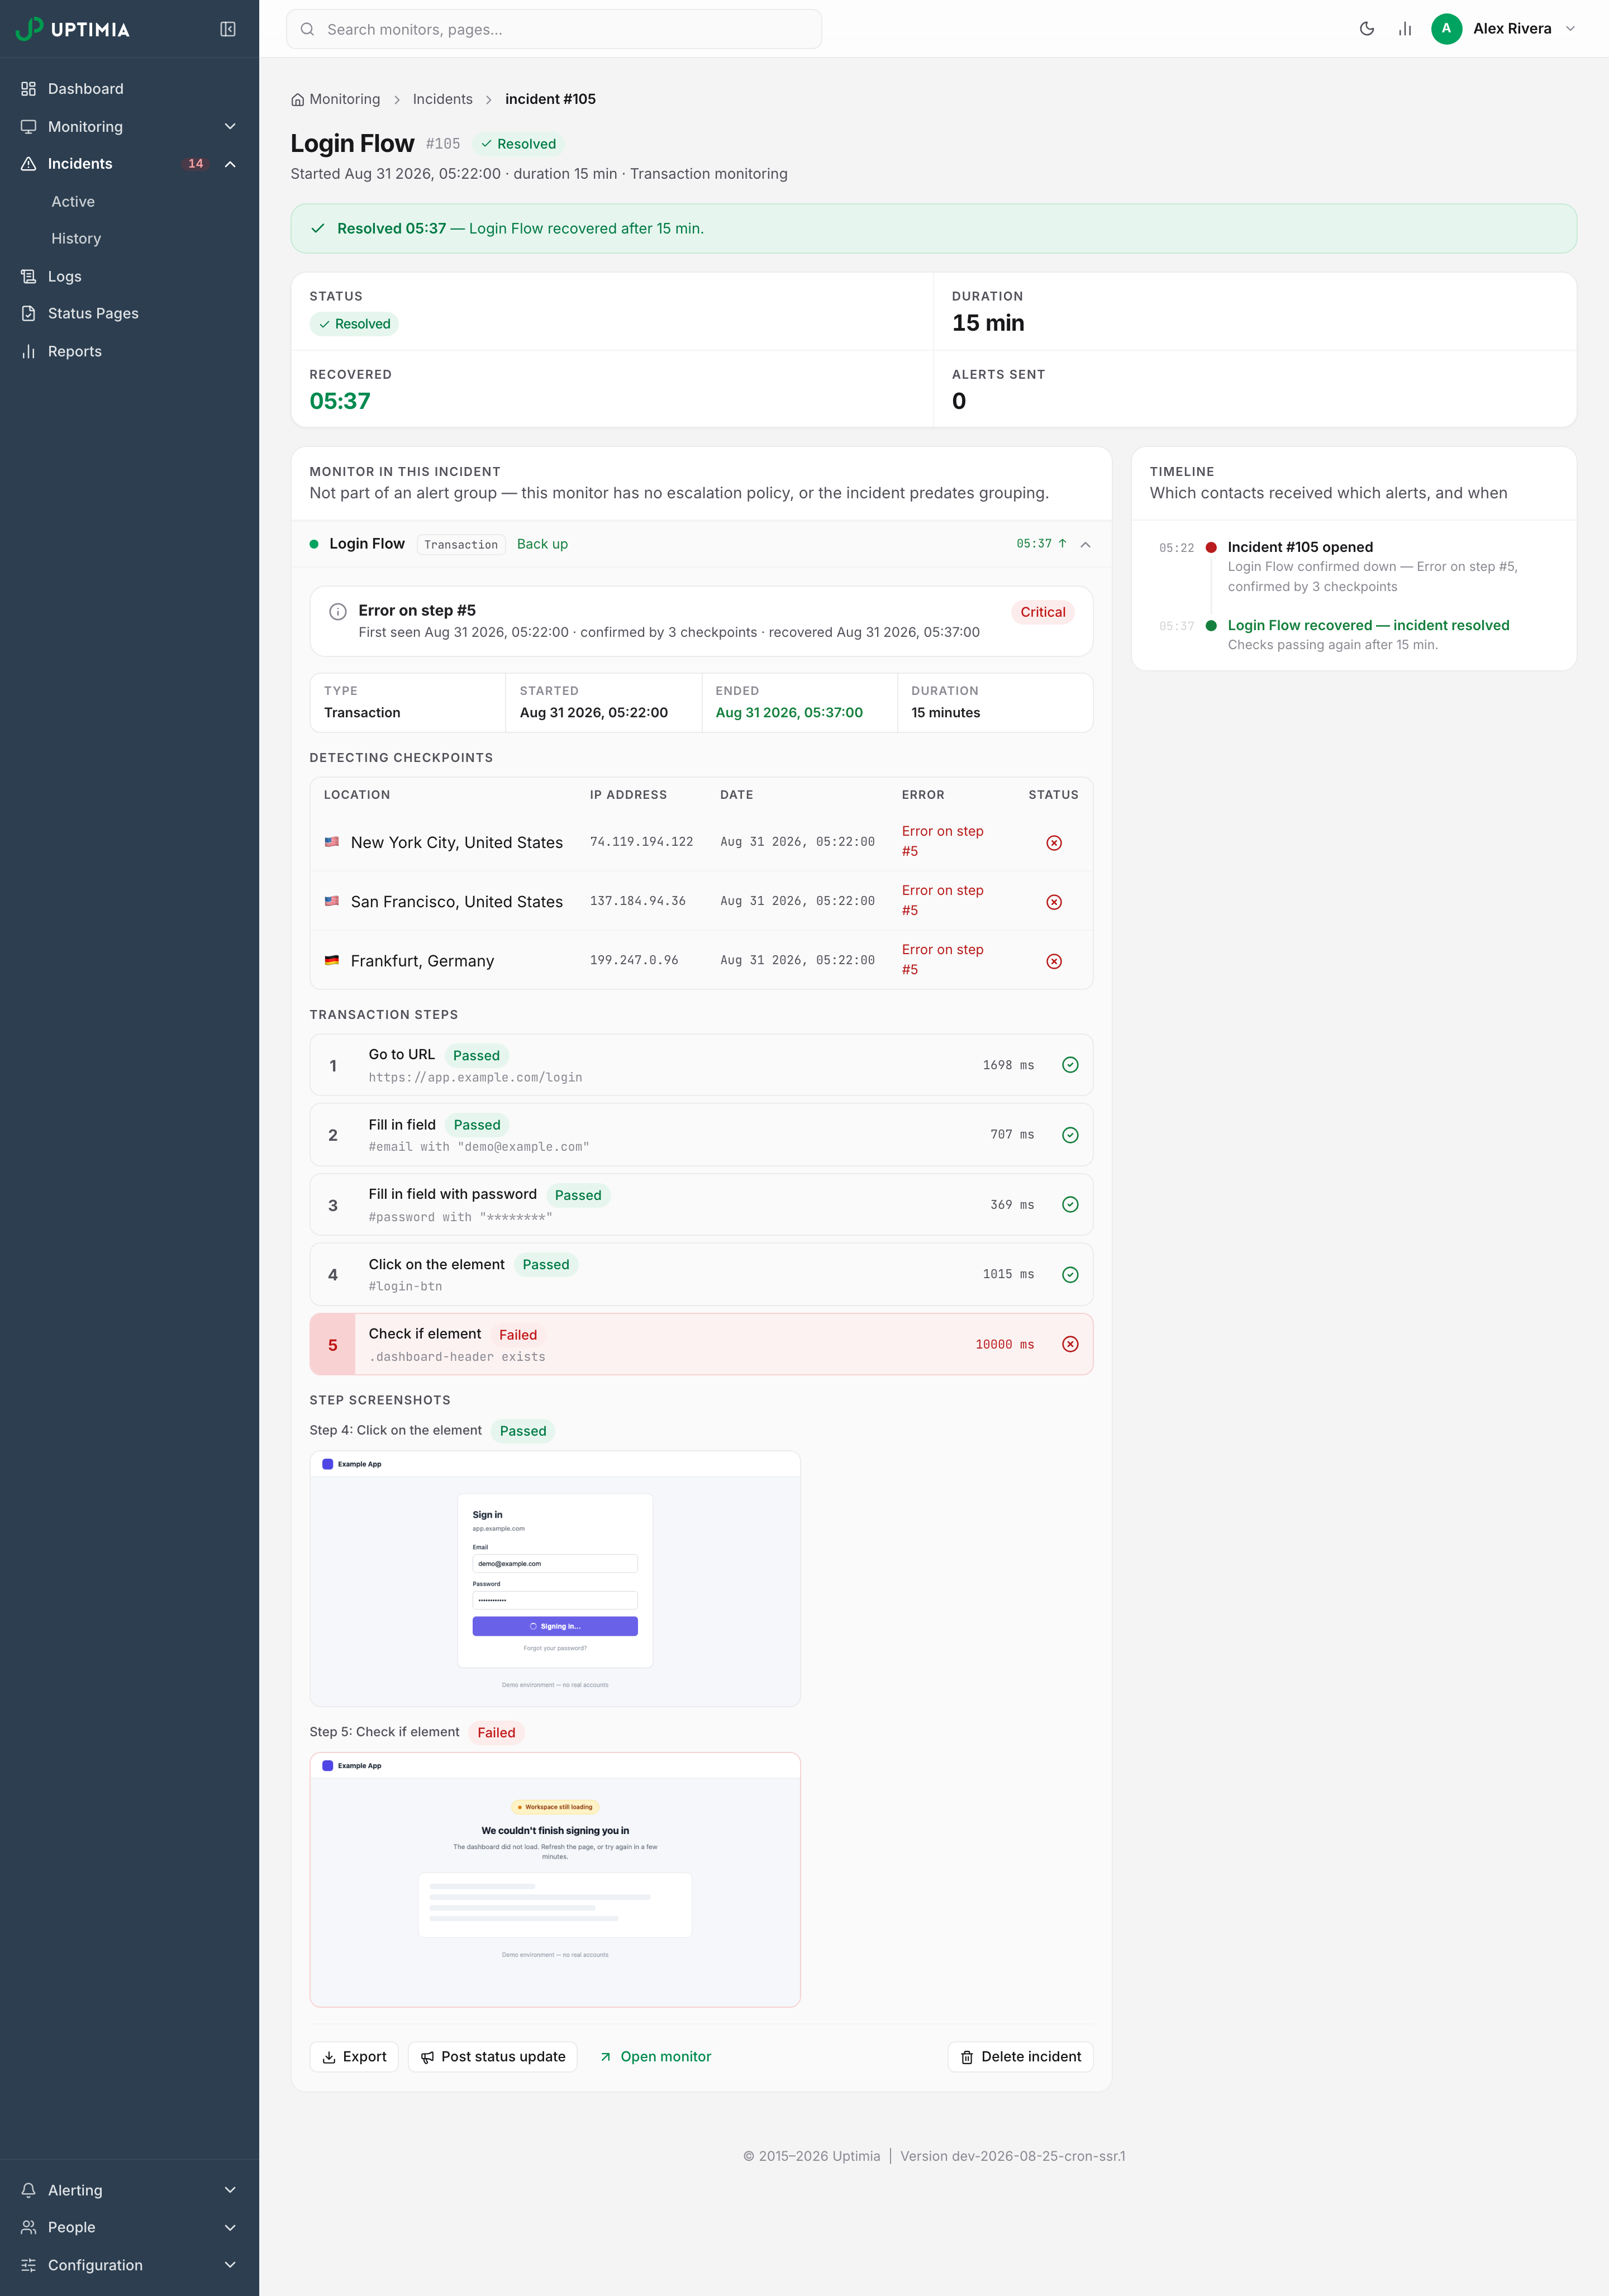
The incident page, for a specific outage. From the Incidents card on the monitor page, click View incident. The page shows a Transaction steps list and a Step screenshots section, side by side on a wide screen and stacked on a narrow one. Each step row shows its action, its stored target, its duration and a Passed or Failed badge. The Export button offers Download PDF, Download HTML and, for anyone who can manage monitors, Create public link.
Note: Step-level evidence for an incident is available for one week from the moment the incident started, and after that the step list and screenshots stop loading. The incident record itself remains. Export the PDF while the incident is fresh if you need to keep it.
What a "Passed" Step Badge Means
This is the single most misread part of a failed run.
Each step row's status is positional. Only the last logged step can carry Failed, and every earlier row is labeled Passed because the run got past it, which means a text check that reads Passed was not necessarily satisfied. The badge says only that the run did not stop there. The incident list labels a text check Check if text; the builder calls it Check text on page.
The small line of code-style text under each action name makes the same kind of claim. It is the step's stored configuration rendered back for readability: the selector, URL or expected value you saved. "Order confirmed" exists in content is what the step looks for, not what the browser found.
Use the step list to find where the run stopped, then confirm what happened from that step's screenshot. The screenshot is the only observation on the page.
The Step Timed Out
This is the most frequent failure.
Cause. The probe keeps retrying. It gives up after 20 attempts, or after 30 seconds on the same step, whichever comes first, and two things exhaust that budget: a selector that no longer matches anything, and a page slower than the flow expects.
Check. Open the failed step's screenshot. A page still loading, or a skeleton placeholder where content should be, is a timing problem. A fully rendered page with the element plainly visible is a selector problem.
Fix.
- Selector problem: open the monitor's step in the builder and run up to that step. Use Suggest to re-pick the selector against the live page.
- Timing problem: add a Wait step before it, or raise that step's Wait before this step value in its Conditions disclosure. That value is capped at 300,000 ms (5 minutes) when you save. The wait runs once, before the step's first attempt. The engine's 30-second retry window starts counting only after it, so the wait itself never trips the timeout. A longer wait cannot make a missing target appear.
The Step Could Not Run at All
Cause. A step whose required field is empty fails immediately rather than timing out: a Click element with no selector, or a Check text on page with no text.
Check. The step's stored target line on the incident page is blank, and its duration is the minimum.
Fix. Open the monitor in the editor and fill the field in. The editor blocks a save on four things:
- an empty primary field ("N steps need values")
- a first step that is not Go to URL
- a Wait duration that is not whole digits
- a Check HTTP status outside 100–599
The Check Passes but the Flow Really Failed
Cause. The flow ends on a Click element or Submit form. A failure page (a wrong password, an item out of stock, an expired session) still loads as a normal, successful page with HTTP 200 and the error printed on the page itself. So the click lands, the run completes and the monitor stays green.
Check. Open the Last run waterfall and look at the final step's screenshot. If it shows an error page while every step reads Passed, this is your case.
Fix. Add a Verify step at the end for something that exists only on success: Check element exists on a dashboard heading, or Check text on page on an order confirmation. Do not add a Wait: a wait is a fixed pause and verifies nothing.
Causes You Can Rule Out
Neither of these is a failure mode, and chasing them wastes a session.
- A target below the fold. The engine scrolls a matched element into view before it clicks, fills or checks it. Position on the page is not a cause.
- A button that opens a new tab. Before every Click element and Submit form, the engine rewrites every link or button that opens a new tab (
target="_blank") so it opens in the same tab (target="_self") instead. The navigation stays in the session's tab. Only a window that the page opens with its own script, throughwindow.open, still escapes. For that one, replace the click with a Go to URL step to the destination.
A Field Was Filled Only Partly, or Not at All
Cause. The fill step ran while the field was still rendering, or while a script still had it disabled. Long email addresses are the usual victim.
Check. The step screenshot shows a partly typed value, or an empty input.
Fix. Give the fill step a Wait before this step value. Then add Check element text after it, comparing the field against the value you typed, which turns a silent half-fill into a visible step failure instead of a green run over a broken form.
Only Some Locations Fail
Cause. Location is the variable. A transaction monitor runs from the probes selected on its Locations tab, or from the location profile attached to it, and a geo-redirect or a regional CDN edge fails on some probes while passing on others. So can a consent banner that appears only in the EU, or a WAF rule that blocks one range of addresses.
Check. Click Logs in the sidebar to open Monitoring Logs, one row per check per probe. See whether the failures cluster on one location. Monitoring Logs covers the filters.
Fix. Allowlist the failing probes, or narrow the monitor's location set to the regions the journey serves.
Reproducing the Failure in the Builder
Replay the step by hand against a live page.
- Open the monitor and go to its step list.
- Click Load on step 1. The builder opens the URL on a probe and starts a session.
- On the failing step, click Run step. It runs only that step against the page the session is on. Click Run to here instead if there is no session yet.
- If the step fails, click View screenshot in the red banner to see what the probe saw.
- Use Suggest on the selector field to re-pick the element from the live page.
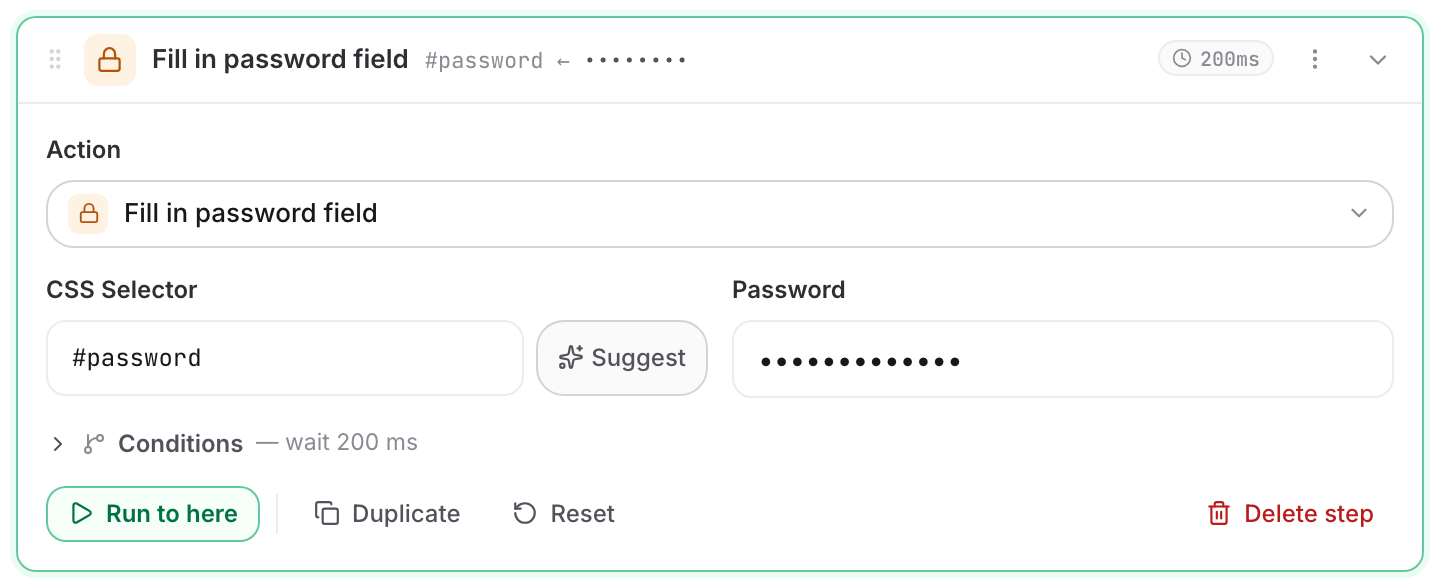
Run step acts on the page as it is right now, so a step that already dismissed a banner or submitted a form will not find its target a second time; reload from step 1 first. Session expired — load the page again means the probe's browser session ended. The step itself is fine. Click Load and carry on.
When to Contact Support
Contact support in three cases:
- The monitor reads Suspended, but the Advanced checks row shows you inside your limit.
- A step fails on every probe, and its screenshot shows the element plainly present and correctly selected.
- Step screenshots do not load for an incident less than a week old.
Include these details:
- The monitor name and the step number that failed.
- The incident's start time, and whether the failure is constant or intermittent.
- The exported incident PDF, or the public link if you created one.
- What the step should have done, and what its screenshot shows instead.
- Any recent change on your side: a redesign, a new login page, a cookie banner, a new payment provider.