
Your application was broken, but Uptimia opened no incident and sent no alert. Four causes explain almost every case:
- The failure returned HTTP 200, so the probe recorded a pass.
- The monitor was configured not to report that class of error.
- The failure was too short or too intermittent to be confirmed.
- The monitor was not checking at all.
Every fix here is one you can make yourself. If you have the opposite problem, meaning alerts arrive while your site is up, read False-Positive and Flapping Alerts instead.
First, Confirm Whether an Incident Was Opened
Before you change any setting, establish what the monitor saw during the window.
- Open the monitor and read the Incidents card. A row here means Uptimia detected the failure, and the question becomes delivery rather than detection.
- Click the incident row. The incident page's stat strip shows Alerts sent, and the Timeline card lists which contacts received which alerts and when. The opening entry names the error. When more than one probe agreed, it adds "confirmed by N checkpoints".
- If there is no incident, read the Check log card ("latest checks, newest first"). Its columns are When, Result, Location and Response time. Click a row to open the check detail. That detail carries the Error field for that one check from that one probe. View all logs opens Monitoring Logs pre-filtered to this monitor.
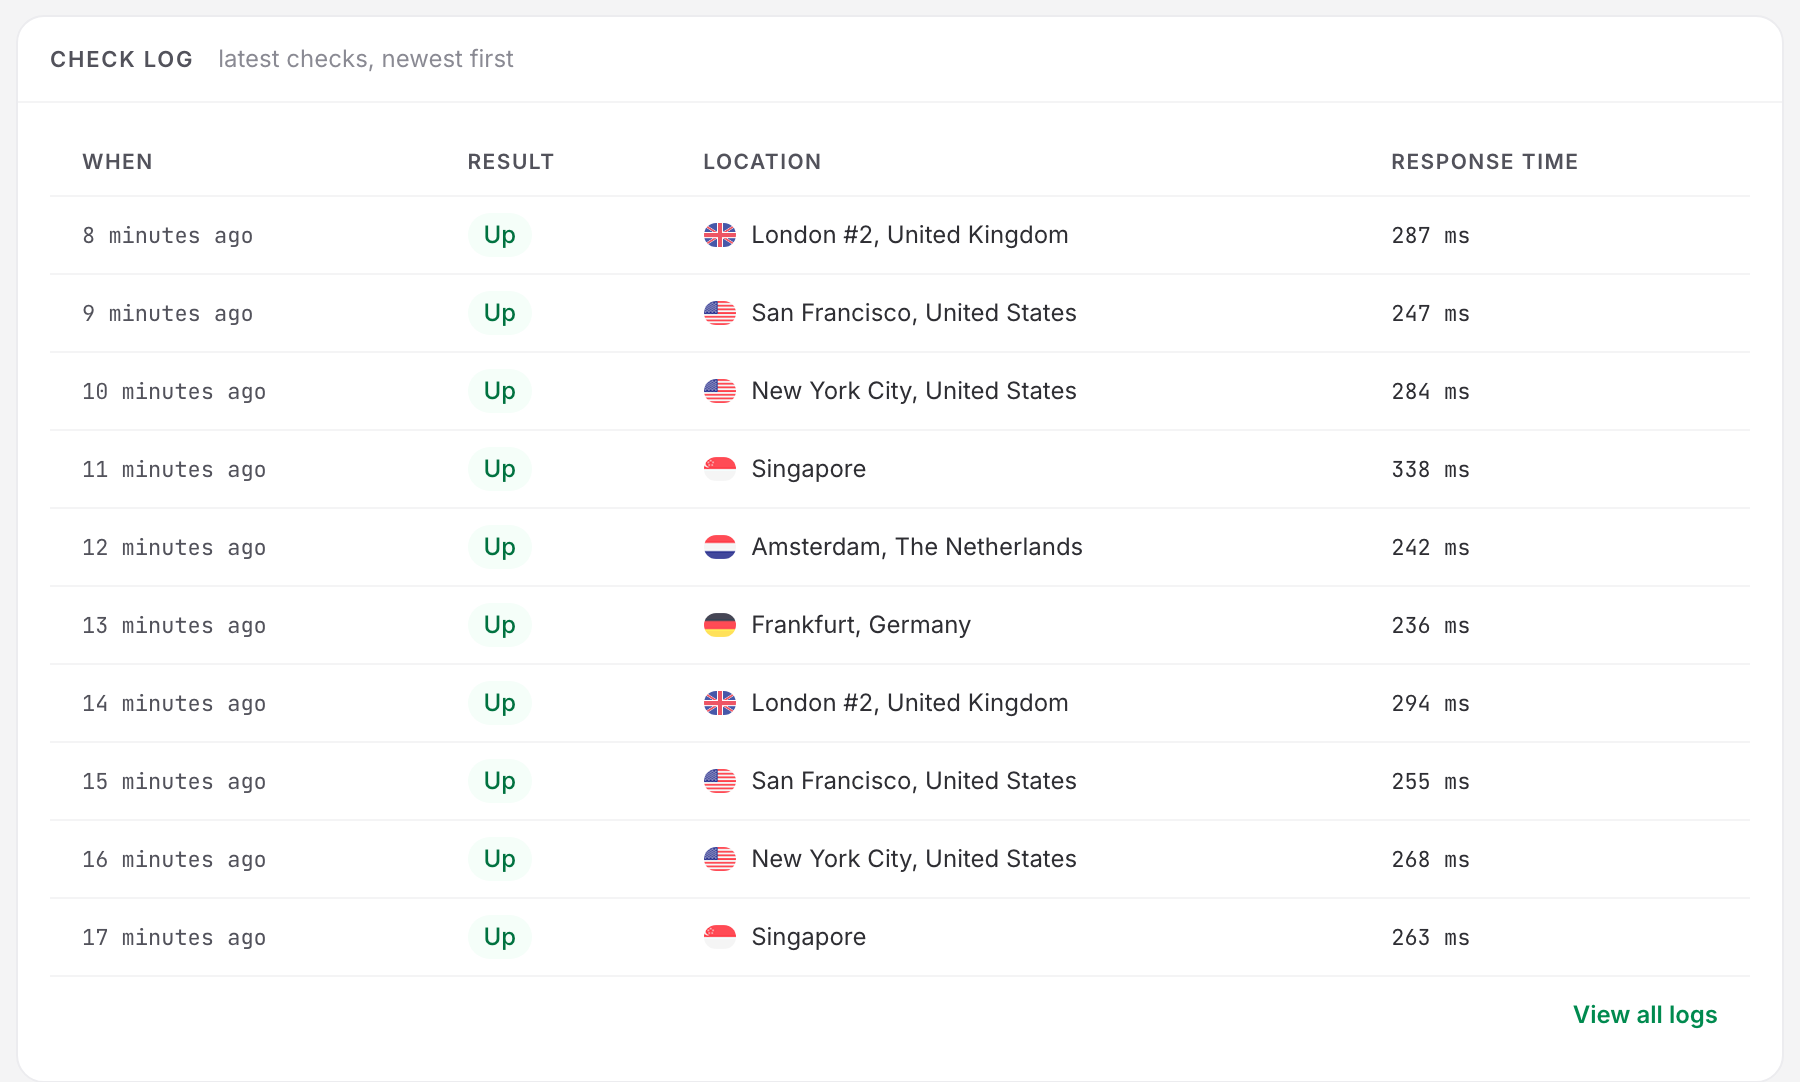
If the check log has no rows at all for the window, the monitor was not checking. Uptimia drops results on arrival while a monitor is paused, suspended or inside a maintenance window. See Why a Monitor Stopped Checking.
If every check in the window passed, work through the causes in this article.
The Failure Returned HTTP 200
An uptime monitor confirms that your URL answers and returns an acceptable HTTP status. It does not read the page unless you tell it to. These failures all return 200:
- A CDN or edge cache serves a stored copy of the page while the origin behind it is down or erroring.
- The framework wraps a database error or a fatal into a styled "something went wrong" page, still a 200.
- A login or checkout fails and the server returns a 200 error page instead of completing the action.
The fix is a keyword check, which makes the probe inspect the response body. In the monitor editor's Main tab, turn on Check if a specific content is on your website, then enter a string. Must exist suits text that appears only when the page renders correctly; Must not exist suits a failure string such as your generic error-page wording. Use Add keyword for more. A monitor carries up to 15 keywords, each with its own Must exist / Must not exist setting. Any one of them failing fails the check.
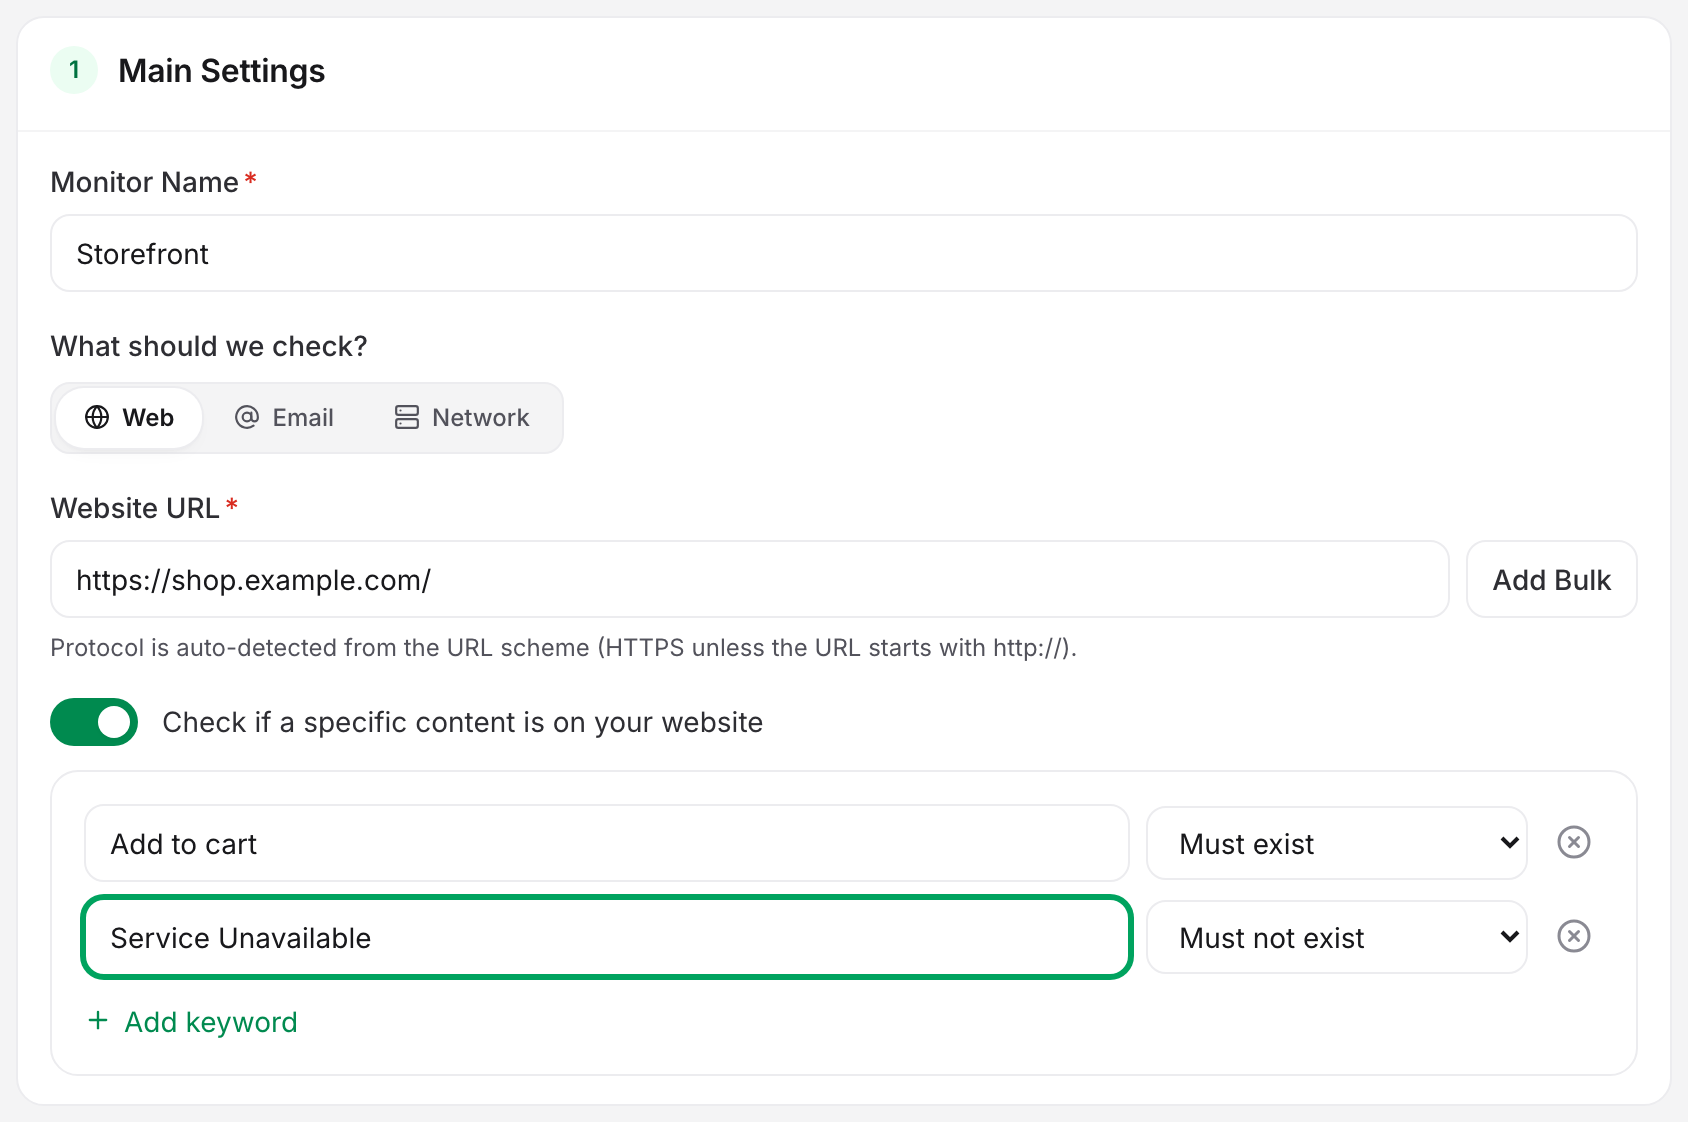
Pick text the server returns in the raw HTML. A string injected by JavaScript after load never reaches the probe. Full setup is in Keyword Checks.
A Keyword Check Cannot Verify a Multi-Step Flow
If the thing that broke was a login, a checkout or a signup, a keyword check on one URL cannot see it. The page still renders; the flow behind it fails.
- Transaction monitors replay a recorded browser journey, the ordered steps a person takes, and fail on the step that breaks. See Transaction Monitoring.
- API monitors run an ordered chain of up to 15 HTTP requests, with per-step assertions.
{{variable}}values extracted from one response carry into the next. See API Monitoring.
Neither draws on your uptime allowance. API monitors have an allowance of their own; transaction monitors share the Advanced checks allowance with Speed monitors. Both are listed in Plan Limits and Quotas.
The Monitor Was Configured Not to Report That Error
An uptime monitor's Advanced tab decides which failures count. If one of these was turned off, the probe saw the failure and filed it as a pass.
Error types to be reported: "Only selected error types will be included in downtime reports". All seven are on by default in the monitor editor. Monitors created for you by the setup screen at sign-up are the exception: they are stored with SSL errors cleared, so a TLS failure during an uptime check on one of those is filed as a pass until you tick it.
| Error class | What goes uncaught if you clear it |
|---|---|
| Connection errors | Refused, reset and unreachable connections |
| Timeouts | The server accepted but never finished answering |
| Unknown errors | Anything the probe could not classify |
| HTTP errors | Every status-code failure, and Rejected HTTP response types disappears with it |
| Redirect errors | Redirect loops and unfollowable redirects |
| Keyword / expected response errors | Your keyword checks: the check runs and its verdict is discarded |
| SSL errors | Certificate failures on an HTTPS target |
Rejected HTTP response types sits nested under HTTP errors and lists which status families count as down. Defaults: 4xx Client Error and 5xx Server Error on; 1xx Informational, 2xx Success and 3xx Redirection off. A monitor with 5xx cleared stays green through a 502.
Timeout settings holds Timeout (seconds), default 30, and Follow HTTP redirects (recommended), on by default. A page that hung for 25 seconds and then answered is a pass at the default timeout. Lower it to the response time your visitors will tolerate.
Every Advanced card that differs from its default carries an edited chip, so you can see which of these was changed. A one-click reset sits on every Advanced card, except HTTP Settings while a Basic Auth password is stored.
The Outage Was Too Short or Too Intermittent to Be Confirmed
Uptimia does not alert on the first failing check. When a probe reports a monitor down, Uptimia dispatches additional backup checks from other probes, and the incident opens only once enough of them agree. That filtering stops one bad network hop from paging you. It also lets a brief or partial fault slip through.
Outage confirmation (editor → Advanced → Outage confirmation → Confirmations required) sets how many backup checks have to agree. The range is 1–3, with 3 as both the default and the recommended value. Every account and every plan gets the control, and it renders for uptime, SSL, Speed, Domain, Transaction, API and DNS monitors. Left at 3, a fault has to survive long enough for three independent backup checks to land on it, so a short outage can end before the third confirmation arrives. Lowering it detects faster and raises the chance of an alert from one flaky probe. The counting rules, including how API and DNS monitors count differently from the rest, are in How Uptimia Monitoring Works.
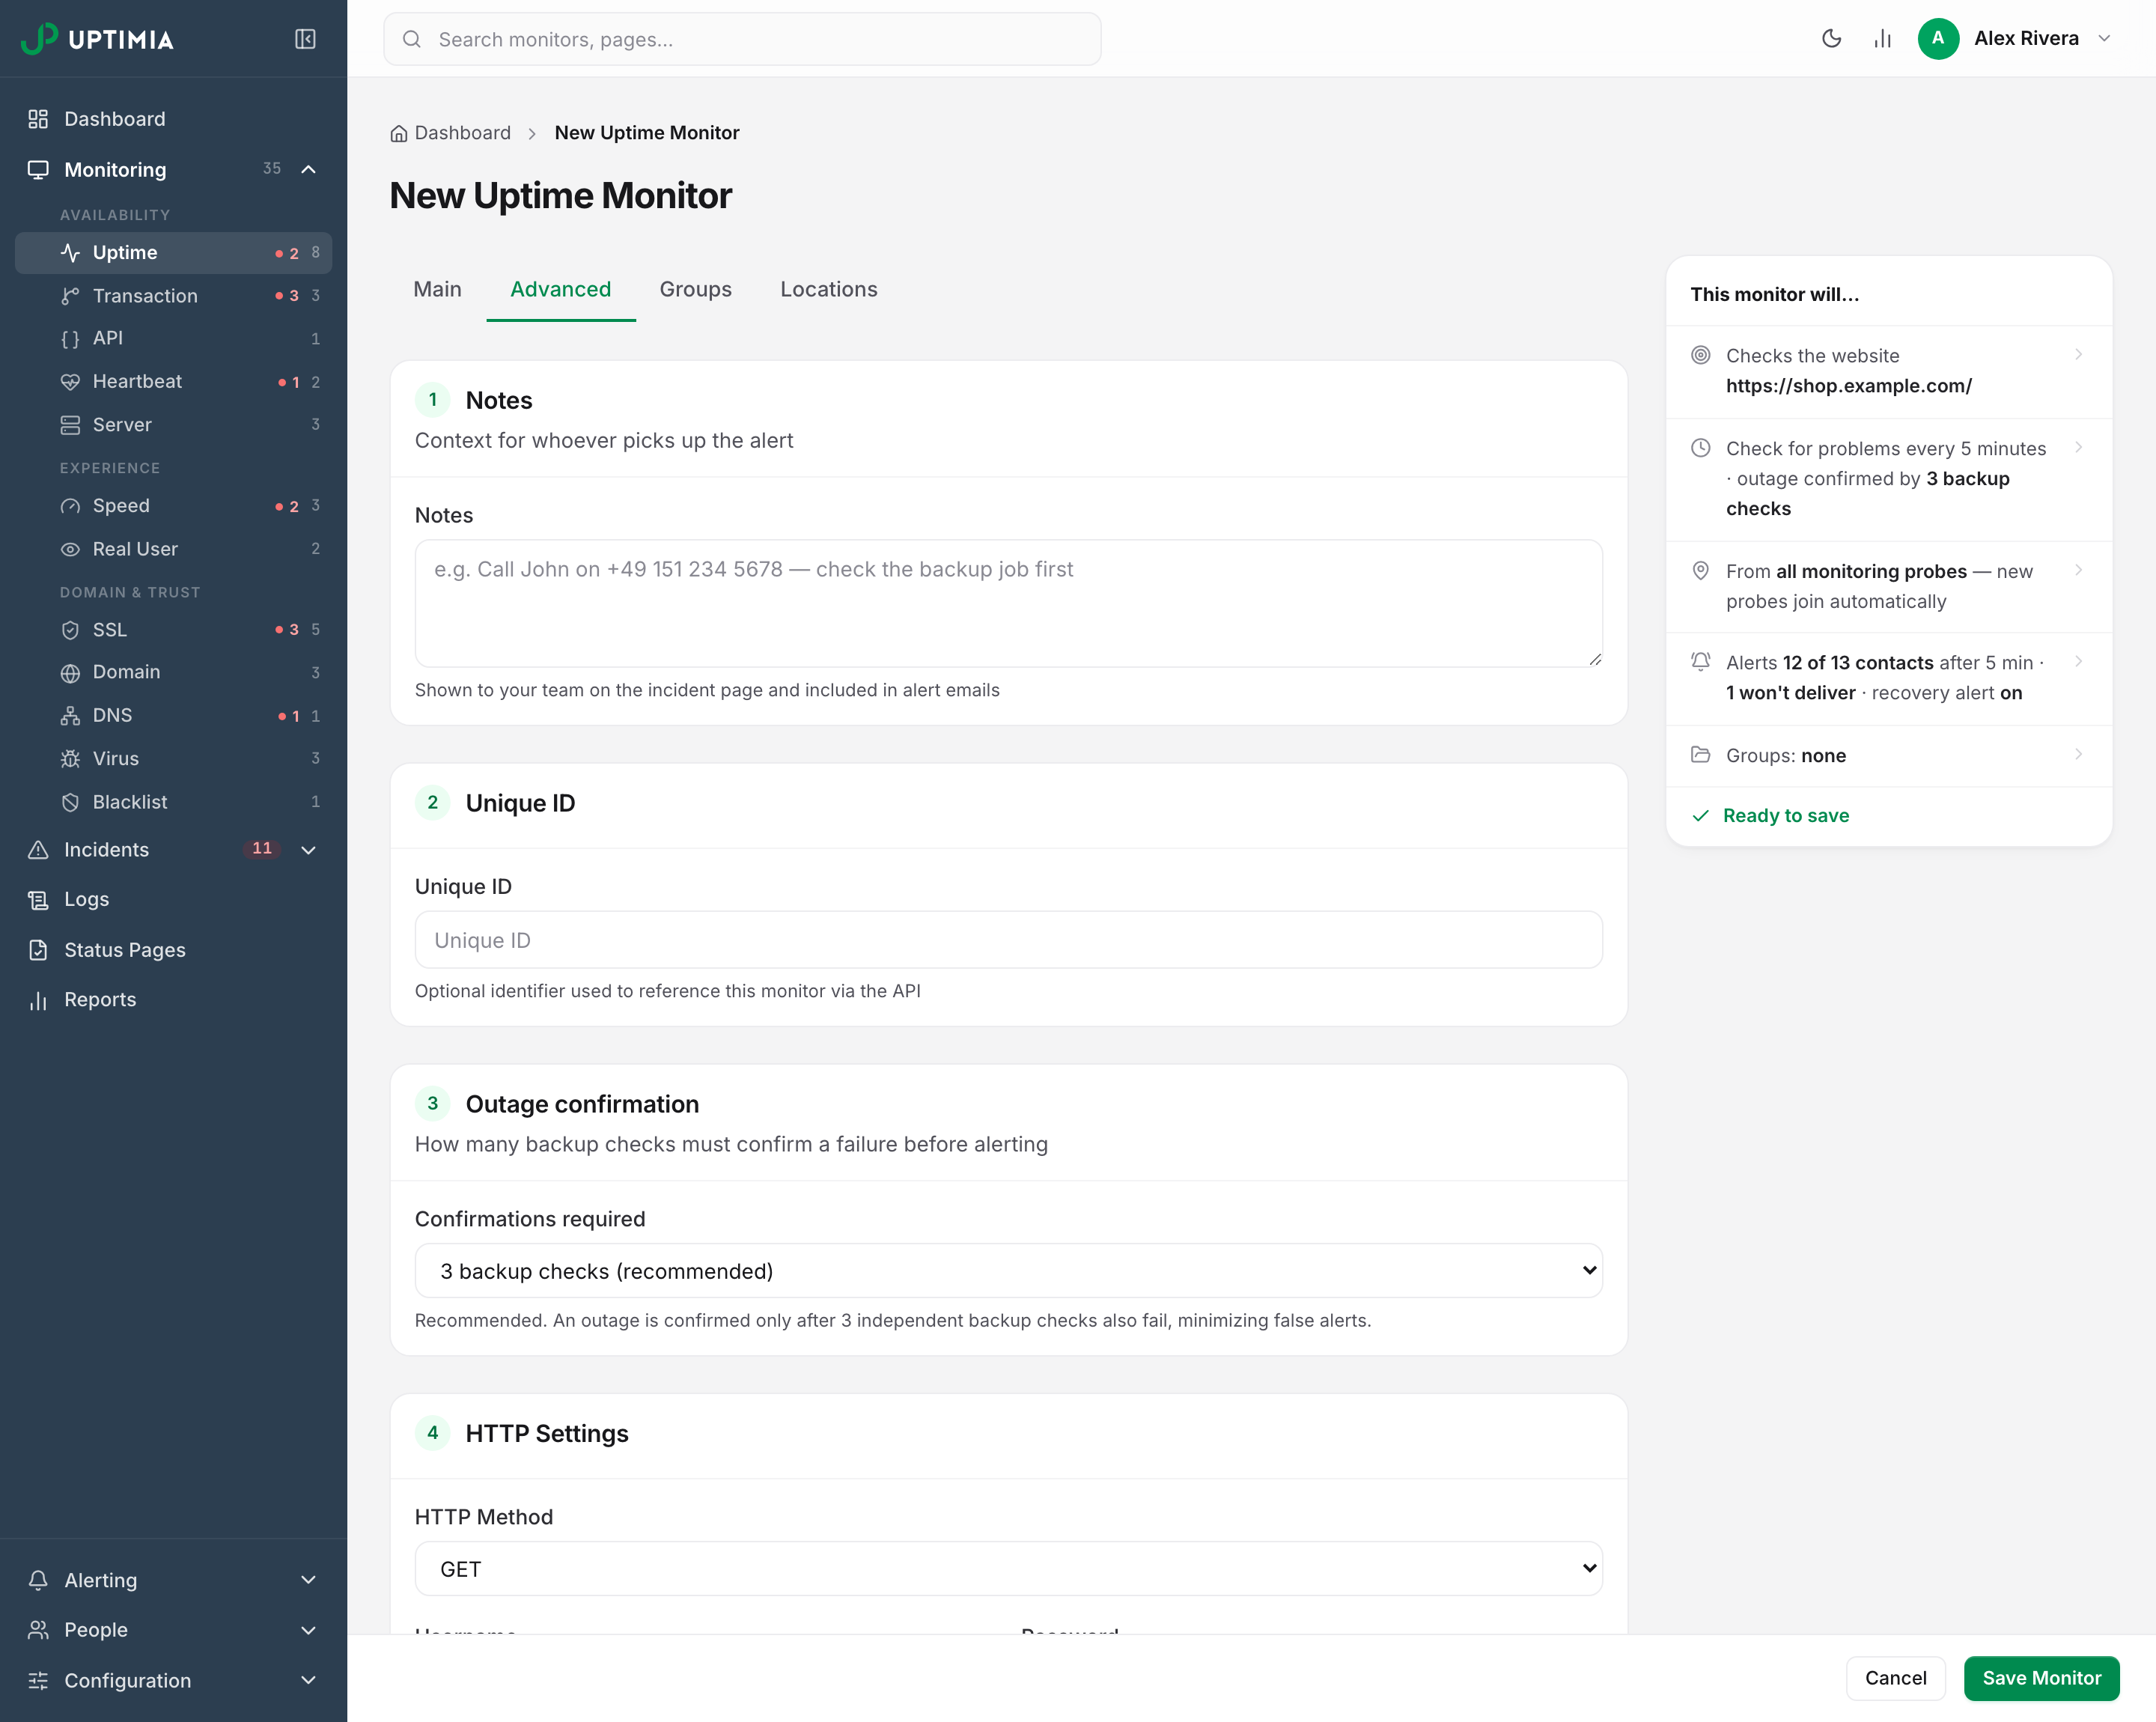
Check frequency decides how often a probe samples the fault, and your plan sets the floor: Free 5 minutes, Basic 1 minute, Professional and Enterprise 30 seconds. The trial runs at the fastest cadence. A fault that lasts 90 seconds normally ends before a 5-minute monitor checks again.
Alert delay (Main tab → Notification Settings) is a 0–30 minute grace period, and it governs when the incident is confirmed, along with when the mail goes out. The editor default is 5 minutes. On monitors created for you by the setup screen at sign-up, it defaults to 1 minute. If the monitor recovers before the delay elapses, Uptimia deletes the pending alert and sends nothing. An outage that clears inside the delay pages nobody unless you lower it. A delay set to absorb deploy noise will also absorb a real 4-minute outage.
Too Few Probes, or Six Probes That Are Not Six Hosts
A monitor checks from All probes unless the selection has been narrowed, and new probes join that set automatically. Uptimia applies one narrowing on its own. On an account whose region is Europe, a new uptime, SSL, Speed, Transaction or API monitor opens with the Europe probe set already selected, and a dismissible note explains it: "Defaulted to European probes based on your account region — switch to 'All probes' any time". Either way, once a monitor is on a Custom selection, two things can weaken it.
The floor is 6 probes. On uptime, SSL, Speed, API and DNS monitors, and on any location profile, Uptimia refuses a custom list of fewer than 6 probes with the message "Please select at least 6 monitoring probes (or use all probes)". Transaction monitors are the exception: only the editor blocks the save, the server does not, so a sub-6 selection that does reach storage really is checked from that few probes. Uptimia never widens routine checks back to the full fleet.
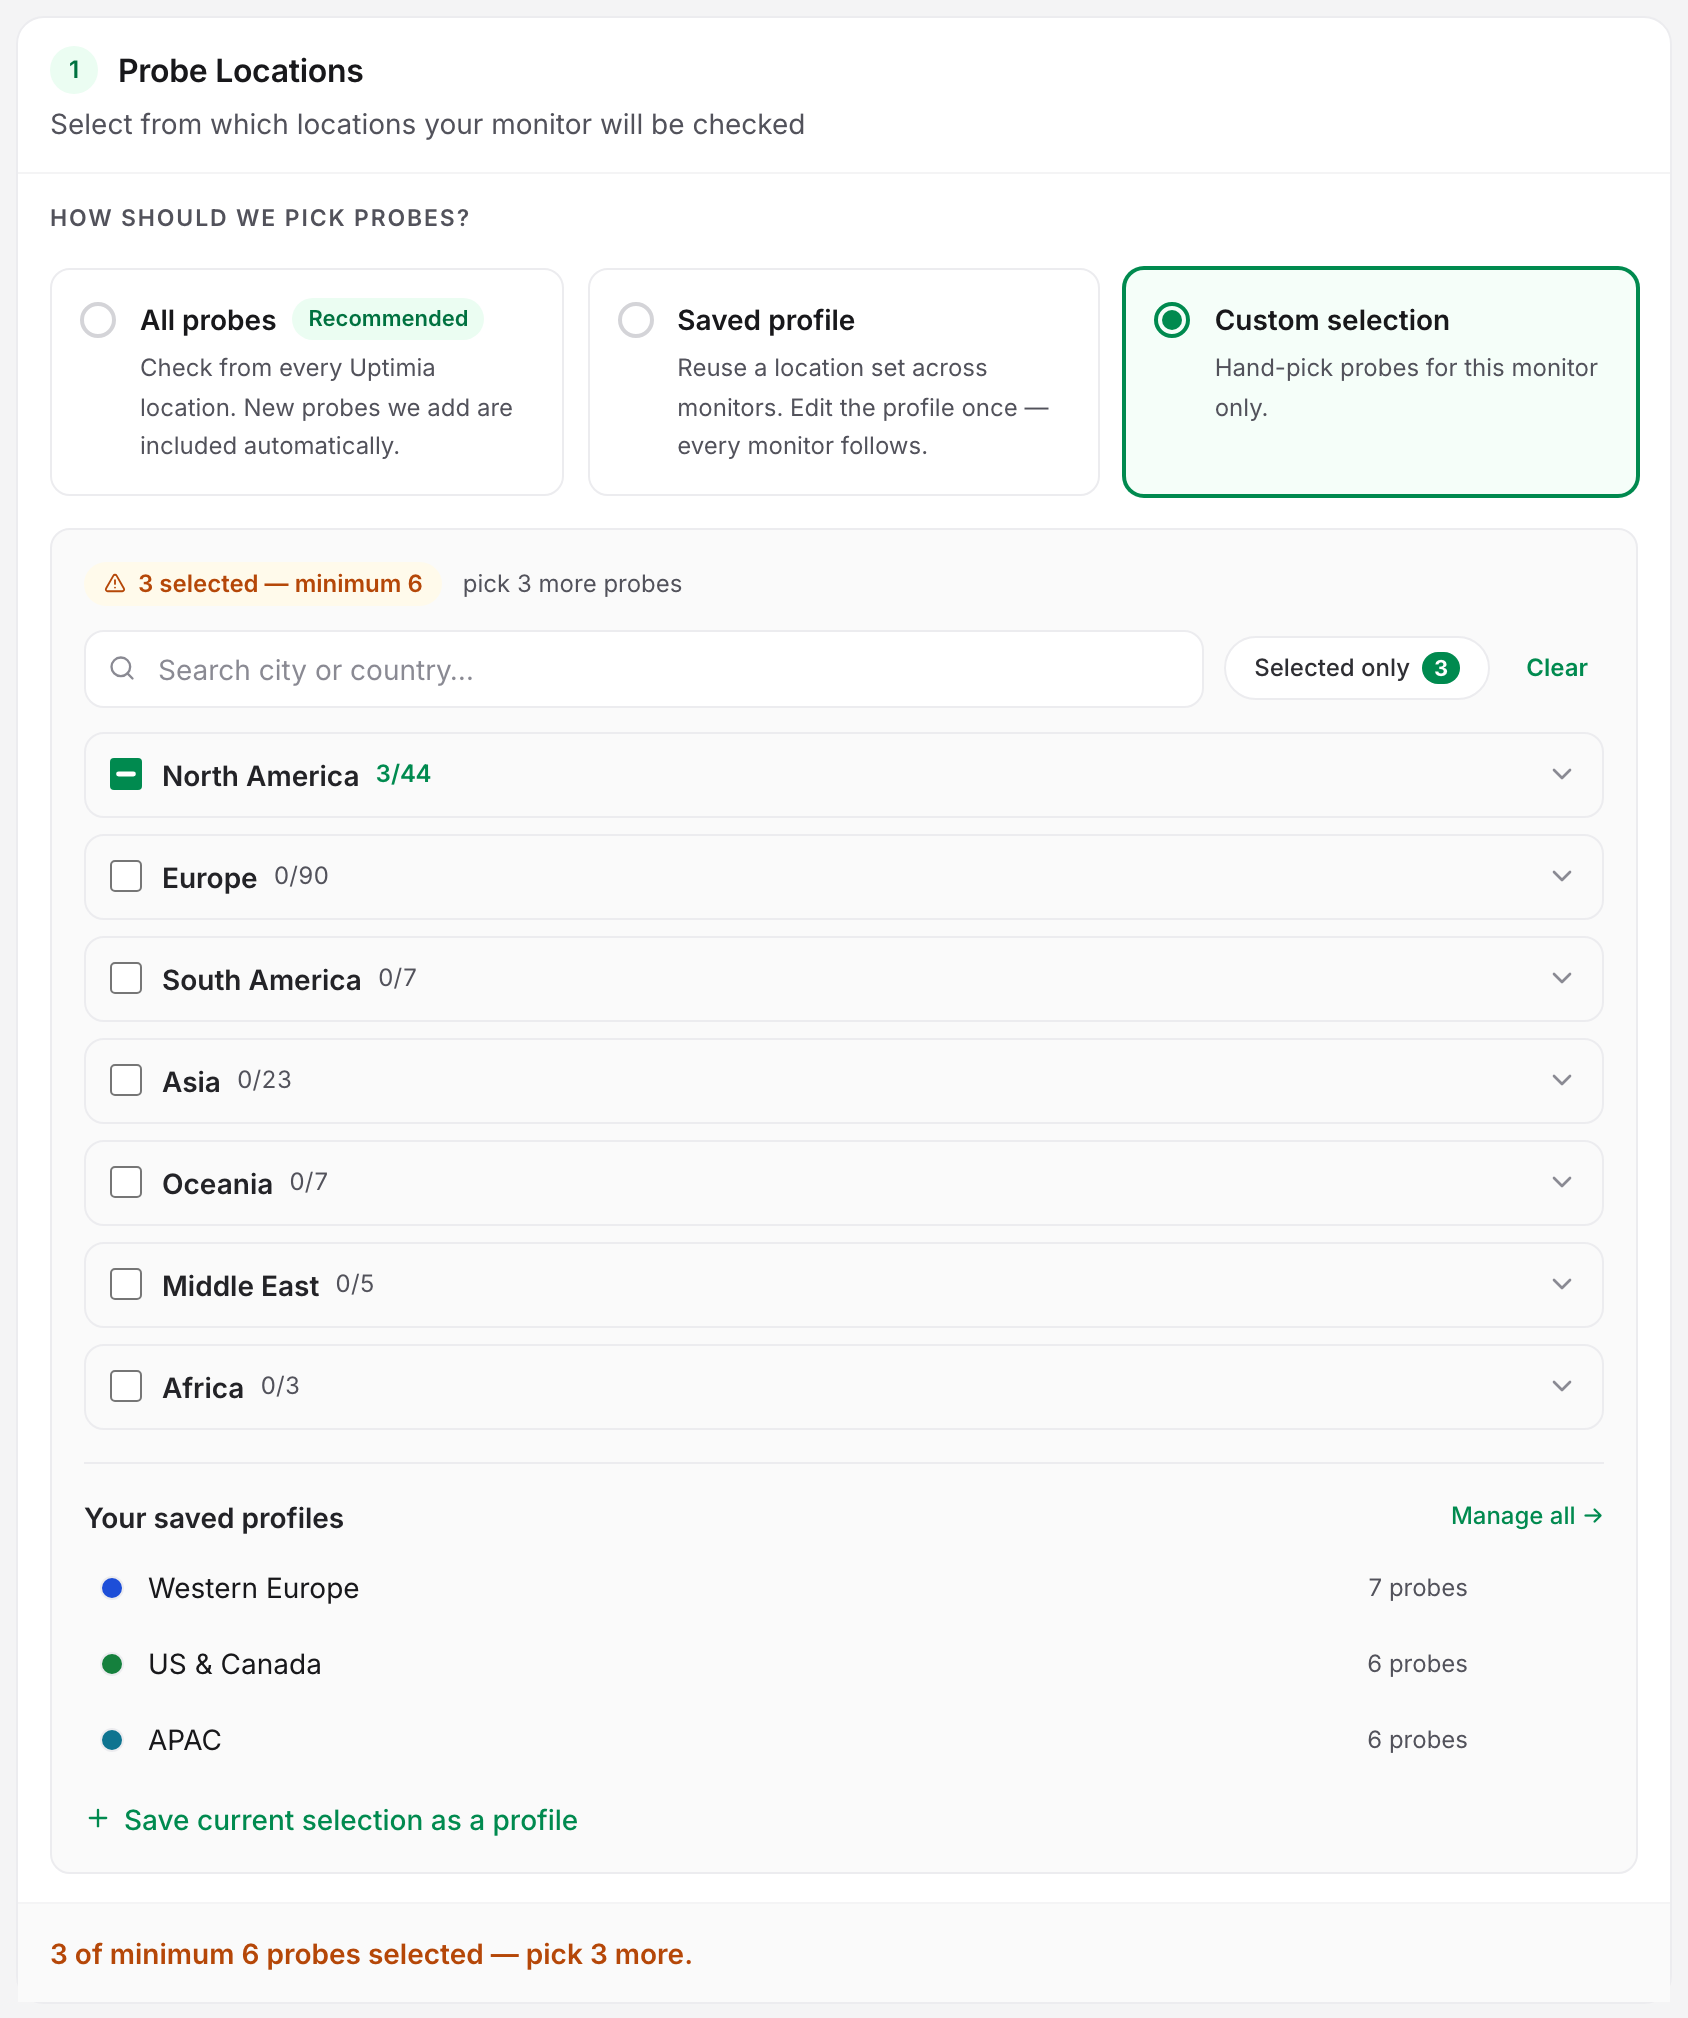
Six selected checkpoints can be two machines. As of August 2026 Uptimia's catalog lists 179 selectable checkpoints running on 138 distinct probe hosts, so 41 checkpoints are aliases of another city's host. Washington D.C. runs on the New York City host, Boston and Newark on New Jersey, and Las Vegas, Baltimore and Cleveland on Los Angeles. Six ids drawn from two of those groups pass every check and are then checked from two machines. From two machines, a real regional fault may never reach the confirmation threshold. Spread a single-region selection across cities that run on distinct hosts. Which cities share a host is listed in Monitoring Locations and Coverage.
Restricting a monitor to one region is the right call for a service that geo-blocks or serves one market, since probes in a blocked region see a block page. Keep 6 or more distinct hosts. Pair the narrow selection with a keyword check, so an expected block stays distinguishable from a failure. To reuse a vetted set across monitors, save it as a location profile. Editing the profile's probe set later rewrites every monitor still using it.
When to Contact Support
If you have confirmed a real outage that produced no incident, and none of these causes fit, contact support with:
- The monitor name and its URL or host.
- The outage window, with dates and times in a named time zone.
- What a visitor saw: the status code, the error page text, or which step failed.
- What the Check log card shows for that window: whether rows exist, and, from the check detail each row opens, the Status and Error on any row that looks wrong.
With those four, support can compare the probe results against what your server logged, and name the setting that would have caught it.