
Your monitor shows green, availability sits at 100%, and customers are emailing you about a broken page. A keyword check closes that gap. It reads the response body and decides up or down on whether specific text is present or absent as well as on the status code, so a page that returns 200 while showing an error can still fail the check. The rest of the uptime editor is in Uptime Monitoring.
Before You Start
- Keyword checks live on an uptime monitor set to the Web sub-type.
- Picking Email (SMTP/POP3/IMAP) or Network (TCP/Ping/DNS/UDP) removes the control. Those protocols match on String to expect (SMTP, POP3, IMAP, TCP, UDP) or Expected Response (DNS) instead, and Ping has no content check at all.
- Keyword matching is available on every plan.
Why a 200 OK Isn't Always Up
By default an uptime monitor only judges the reply code the server sends back, and any success code passes the check. That is the right answer most of the time. But a server can also return a valid 200 OK while the application behind it is broken:
- A CDN or reverse proxy serves a cached copy while the origin is failing.
- The web server is up, but the database or upstream API it depends on is not.
- The application catches its own error and renders a friendly "Something went wrong" page, still with a 200.
- A deploy swaps in a maintenance or placeholder page that responds successfully.
In each case the HTTP layer is healthy and a status-code check stays green. Only a content check catches the failure.
Turning On a Keyword Check
- Create a new uptime monitor, or open an existing one and click Edit.
- On the Main tab, set What should we check? to Web.
- Turn on Check if a specific content is on your website.
- Type the text in the Keyword box and pick Must exist or Must not exist beside it.
- Click Add keyword for each further rule.
- Click Save Monitor. The rule applies from the next check.
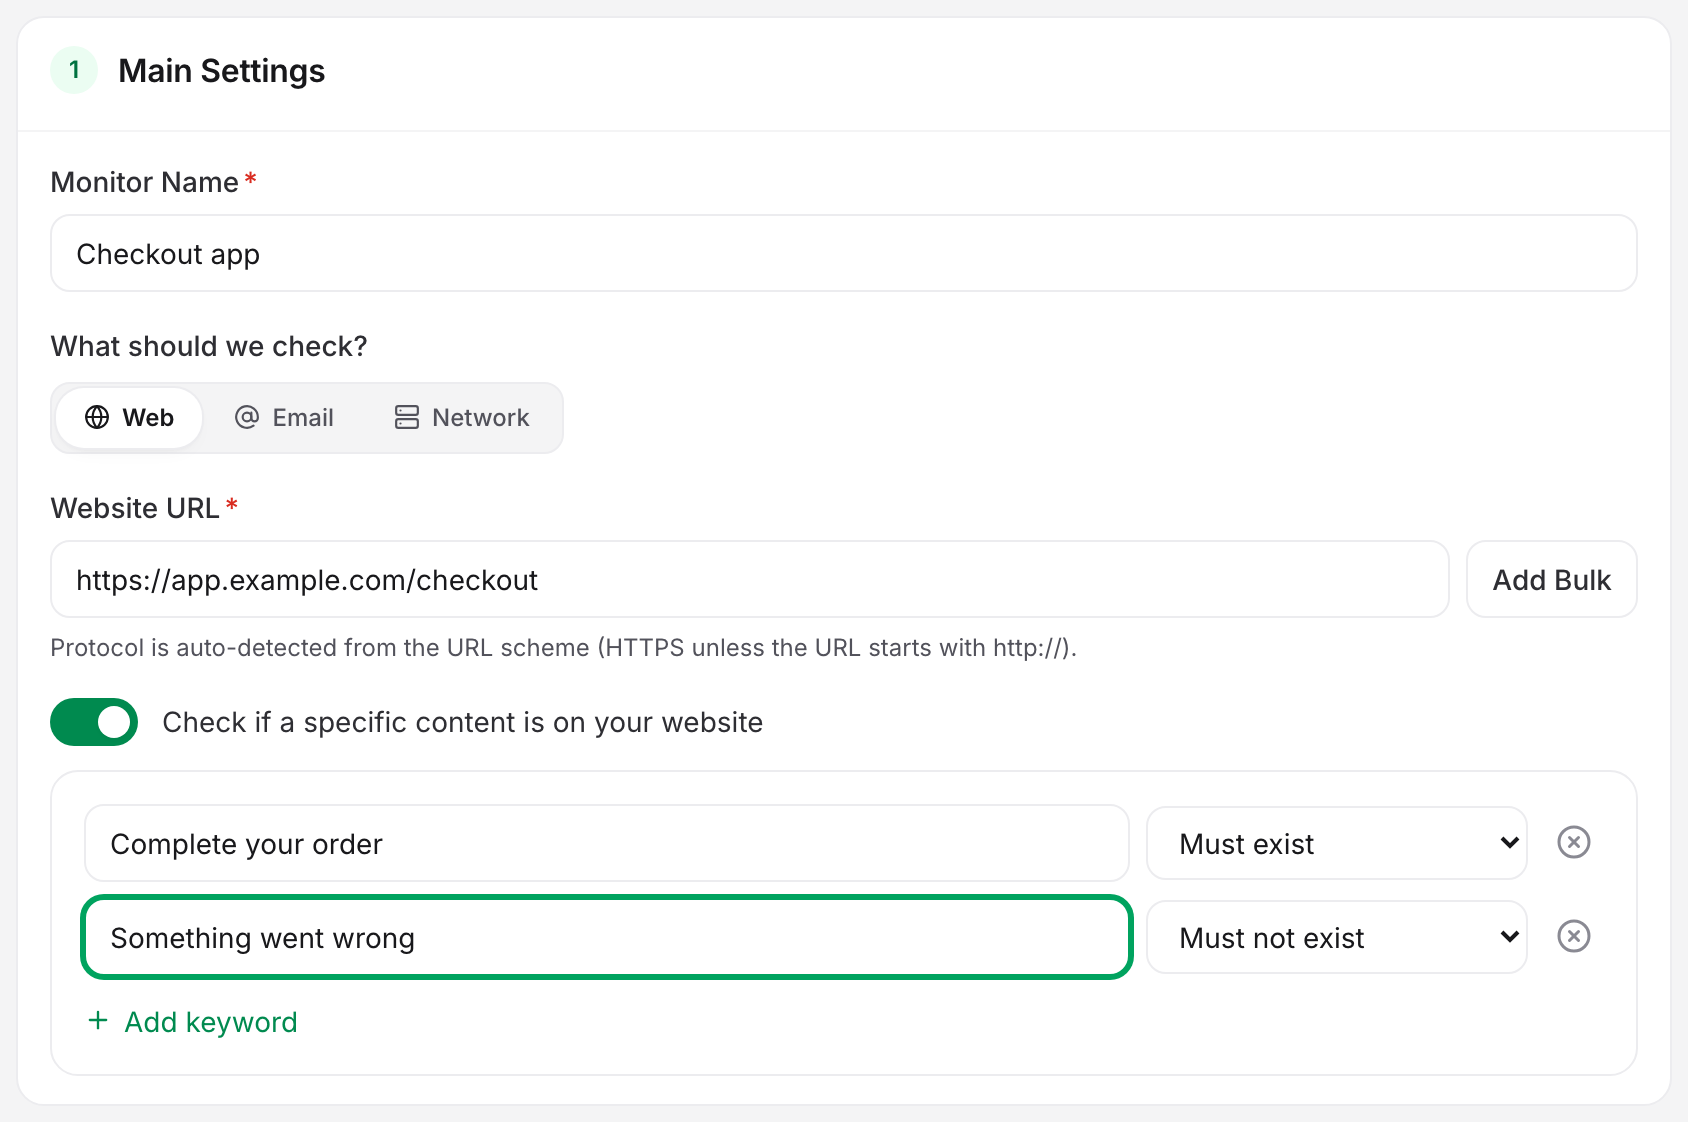
The editor holds up to 15 keyword rules per monitor, and once you reach the cap the Add keyword link disappears. Remove a rule with the × beside it to free a slot.
Must Exist and Must Not Exist
| Rule | The check fails when | Use it for |
|---|---|---|
| Must exist | The text is absent from the response body | Something only a healthy page renders: a price pulled from the database, an Add to cart button, a logged-in account widget |
| Must not exist | The text is present in the response body | A known failure signature: "Fatal error", "Service unavailable", your application's generic error message |
Uptimia evaluates every rule on the monitor at every check. One failing rule fails the check.
Choose text that is stable and specific. Wording that changes between visits produces alerts you cannot trust, and so does wording that appears on both the healthy and the broken page.
What Happens When a Keyword Check Fails
A failed keyword check goes through the same confirmation as any other failure before anyone is paged: backup probes re-run it, and the incident opens only when enough of them agree. The default is 3 probes, set in the monitor's Outage confirmation card. That is why a genuine keyword failure can take one extra round to alert. How Uptimia Monitoring Works covers the mechanism.
Once the outage is confirmed and the alert delay elapses, Uptimia opens the incident and notifies the monitor's recipients; the event appears on the monitor page in the Incidents card and in the Check log card. When the page recovers and the rules pass again, the incident resolves. Uptimia sends a recovery alert if Alert when the website comes back up is on.
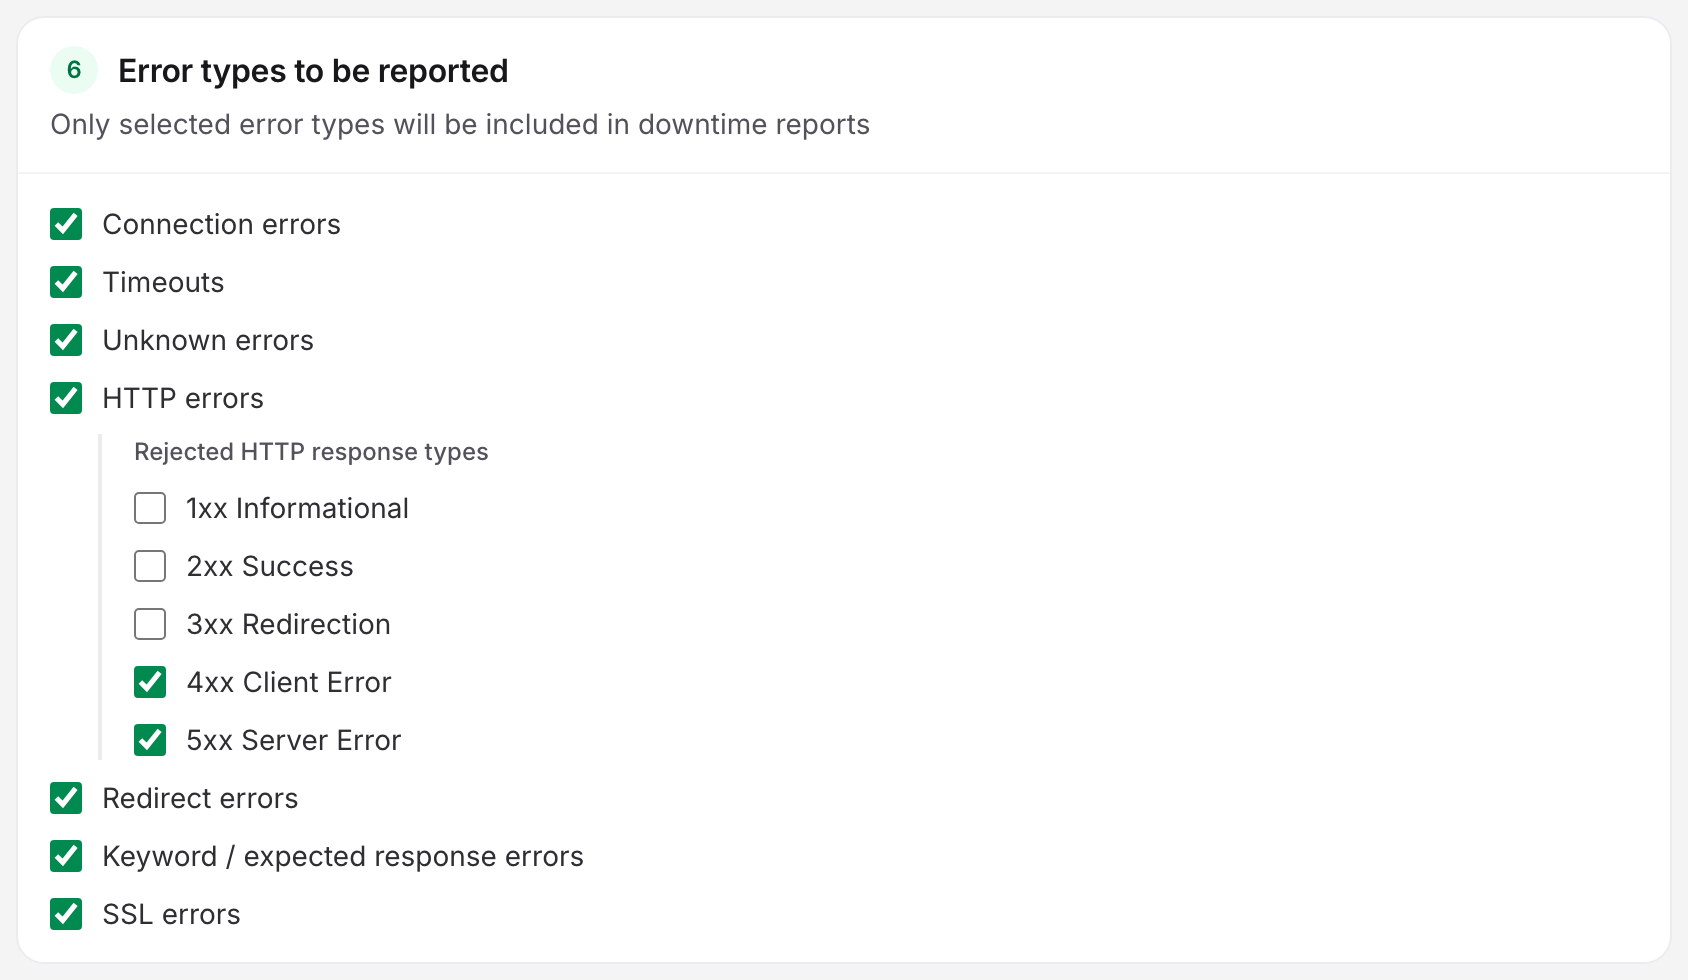
Uptimia reports keyword failures only while Keyword / expected response errors is ticked in the Advanced tab's Error types to be reported card. It is on by default.
Seeing Why a Check Failed
The check log keeps the failure reason and the response headers the probe received. The incident keeps the response body. You can read the failure instead of reproducing it.
- Open the monitor and scroll to the Check log card.
- Click the failing row. The check detail drawer opens.
- Read Error for the failure reason, Location for the probe that saw it, and Keyword expect for the rules the monitor carries.
- The Response section holds the response headers the probe recorded, not the page body. To read the body, open the incident from the Incidents card and expand Response body under Evidence.
Uptimia keeps Error and Response for 7 days on every plan. An older check row is still listed, with its timings, status and location, but those two fields come back empty. The incident's own evidence stays readable for the rest of your plan's window.
Keyword expect shows the rules the monitor carries right now, not the rules it carried when the check ran. Edit the rules after an incident and the drawer shows the new ones.
If the rules are right and the page looks fine in your own browser, the probe received something different from what your browser did. Look for a bot rule, a geo-block or a cached edge response. Why Didn't Uptimia Detect My Outage? walks through that split.
You can also do all of this from a script. See Getting Started with the Uptimia API.
When a Keyword Rule Is the Wrong Tool
A keyword rule reads the raw response body as text. For a JSON API that answers 200 with an error payload, an API monitor fits better: it can check the status code, check a single field inside a JSON response, and reuse values from an earlier request in the chain. See Assertions, Extractions and Variables.