
Uptimia has three ways to work on many monitors at once:
- Bulk creation turns a pasted list of URLs into monitors that share one set of settings.
- Bulk actions on the dashboard pause, resume, schedule maintenance for or delete every monitor you have selected.
- Bulk apply on a location profile repoints many monitors to the same probe set.
To reuse one monitor's full configuration a monitor at a time instead, see Monitor Templates.
Before You Start
- Bulk creation and bulk actions both need the Editor, Admin or Owner role. Read-only and Accounting / Billing seats cannot open the monitor editor at all.
- Your account email must be verified before you can create Uptime, SSL, Domain, Speed or Virus monitors, in bulk or one at a time.
- Have at least one alert contact ready. Uptimia refuses a bulk batch with no recipients selected, before it creates anything.
Which Monitor Types Support Bulk Creation
The Add Bulk toggle appears in the monitor editor for five families:
| Family | Bulk creation in the editor |
|---|---|
| Uptime | Yes |
| SSL | Yes |
| Domain | Yes |
| Speed | Yes |
| Virus | Yes |
| Real User | No (no bulk field in the editor) |
| Transaction | No (refused; each one carries its own recorded steps) |
| Heartbeat, Blacklist, DNS, API, Server | No |
For the seven families with no bulk flow, create monitors one at a time, or save one as a template and reuse it. See Monitor Templates.
Creating Monitors in Bulk
- Go to Monitoring → Uptime, or whichever type you want, and open the create form. Click Create Uptime Monitor on the onboarding page if you have no monitors of that type yet. If you already have some, use Add Monitor at the foot of the monitors panel.
- Click Add Bulk beside the target field. A multi-line box replaces the single-URL field. Add Single switches back.
- Paste your URLs, one per line, as either
url,nameor a bare URL. - Fill in the shared settings on the Main, Advanced, Groups and Locations tabs. Uptimia applies everything you set there to every monitor in the batch.
- Click Preview & Create. Uptimia parses the list and opens the Confirm Bulk Monitor Creation modal, showing Name, URL and Status for each row.
- Check the parsed names and URLs, then click Create N Monitors. The button counts only the rows marked Valid.
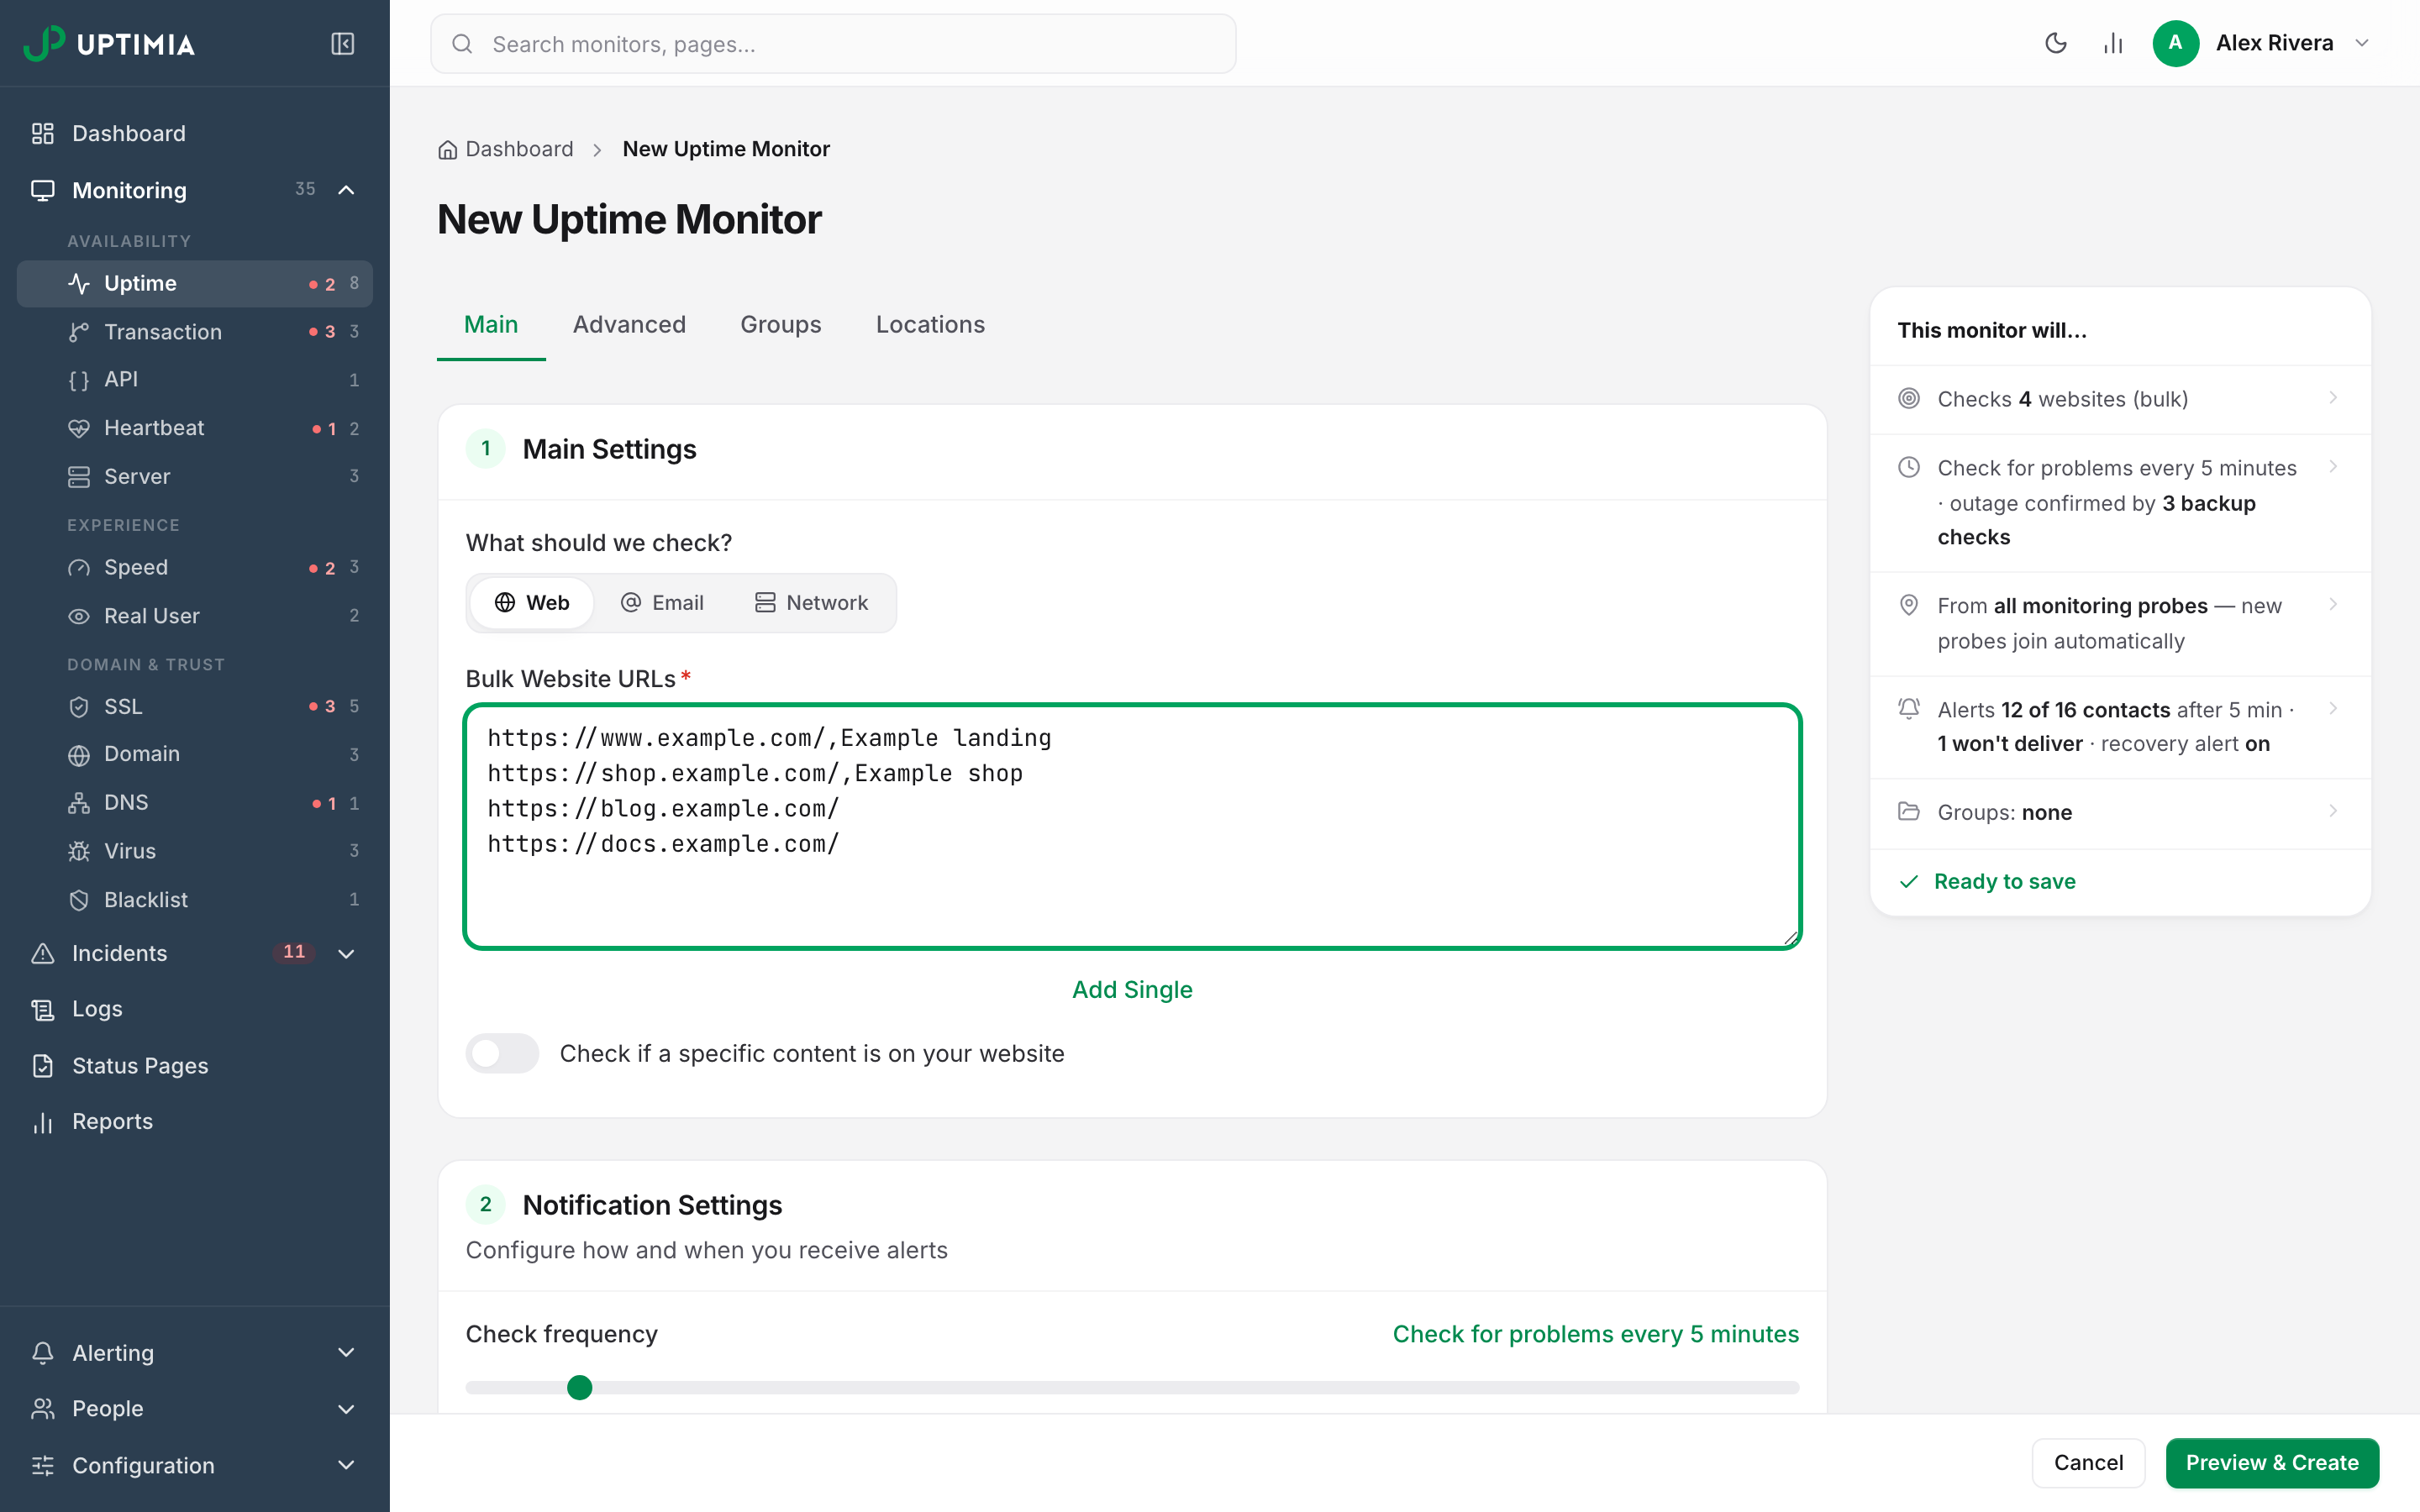
On success Uptimia reports how many monitors were created and takes you to that type's monitor list.
The List Format
One entry per line. Only the URL is required.
https://www.example.com/,Example landing
https://shop.example.com/,Example shop
https://blog.example.com/
url,name: the text after the first comma becomes the monitor name. Double quotes are stripped from both halves, so"https://www.example.com/","Example"works. A quote inside a name is removed too, soAcme "Prod"is stored asAcme Prod.- A bare URL: Uptimia generates the name from the hostname.
https://blog.example.com/becomes a monitor namedblog.example.com. - Uptimia adds a missing scheme:
https://for Uptime and SSL rows,http://for Speed, Domain, Virus and Real User rows. - Blank lines are skipped.
A row is marked Valid or Invalid on URL format alone. Three things must hold: the string parses as a URL, the host contains a dot, and the top-level domain is at least 2 characters. Invalid rows stay in the table so you can see which line was wrong, and they are excluded from the create.
Shared Settings
In bulk mode the editor still renders the controls below, and Uptimia applies each one to every monitor in the batch:
| Applies to every row | Which families |
|---|---|
| Check frequency, alert delay, Alert when back up | All five |
| Alert contacts and the escalation policy you pick | All five |
| Monitor groups and the email branding theme | All five |
| Outage confirmation threshold | Uptime, SSL, Speed, Domain |
| Probe locations (all probes, a saved profile or a custom selection) | Uptime, SSL, Speed |
| HTTP method and body, HTTP Basic Auth credentials, custom headers, timeout, follow-redirects, reported error types, keyword check | Uptime |
| Certificate expiry warning days and the Trouble-to-Down delay | SSL |
| Registration expiry warning days | Domain |
| Speed threshold and its alert window | Speed |
Domain and Virus monitors have no Locations tab. Uptimia checks them without a probe selection.
Two settings stay per-monitor and are hidden while bulk mode is on: Notes and Unique ID. The Advanced tab says so in place of them, and a Unique ID must be unique on the account, so a shared one would create the first monitor and fail every row after it. Add both after the batch exists.
Switching to a monitor type that has no bulk flow (Real User, Transaction, API, Heartbeat, Blacklist, DNS or Server) clears bulk mode and the pasted list. Switching between two bulk-capable families keeps both, so re-read the list against the new type before you preview.
What Is Checked, and When
Preview and create check different things.
| Check | Preview | Create |
|---|---|---|
| URL format | Yes, sets Valid / Invalid per row | No |
| List is not empty | Yes, shows Please enter URLs to add in bulk | No |
| At least one alert contact selected | Yes, you are sent back to the Main tab | Yes, per row |
| Custom probe selection has at least 6 probes | Yes, you are sent to the Locations tab | Yes, re-checked once for the whole batch |
| Escalation policy belongs to your account | No | Yes, once for the whole batch |
| Duplicate monitor name | No | Yes, per row |
| Plan quota for the family | No | Yes, per row |
| Email address verified | No | Yes, per row |
| URL is not on Uptimia's blocked-domain list | No | Yes, per row |
Uptimia enforces the plan quota row by row, not per batch. Rows that fit are created; only the rows that would exceed the pool fail. A batch is never rejected as a whole for being too big, so never assume "nothing was created" and paste the list again.
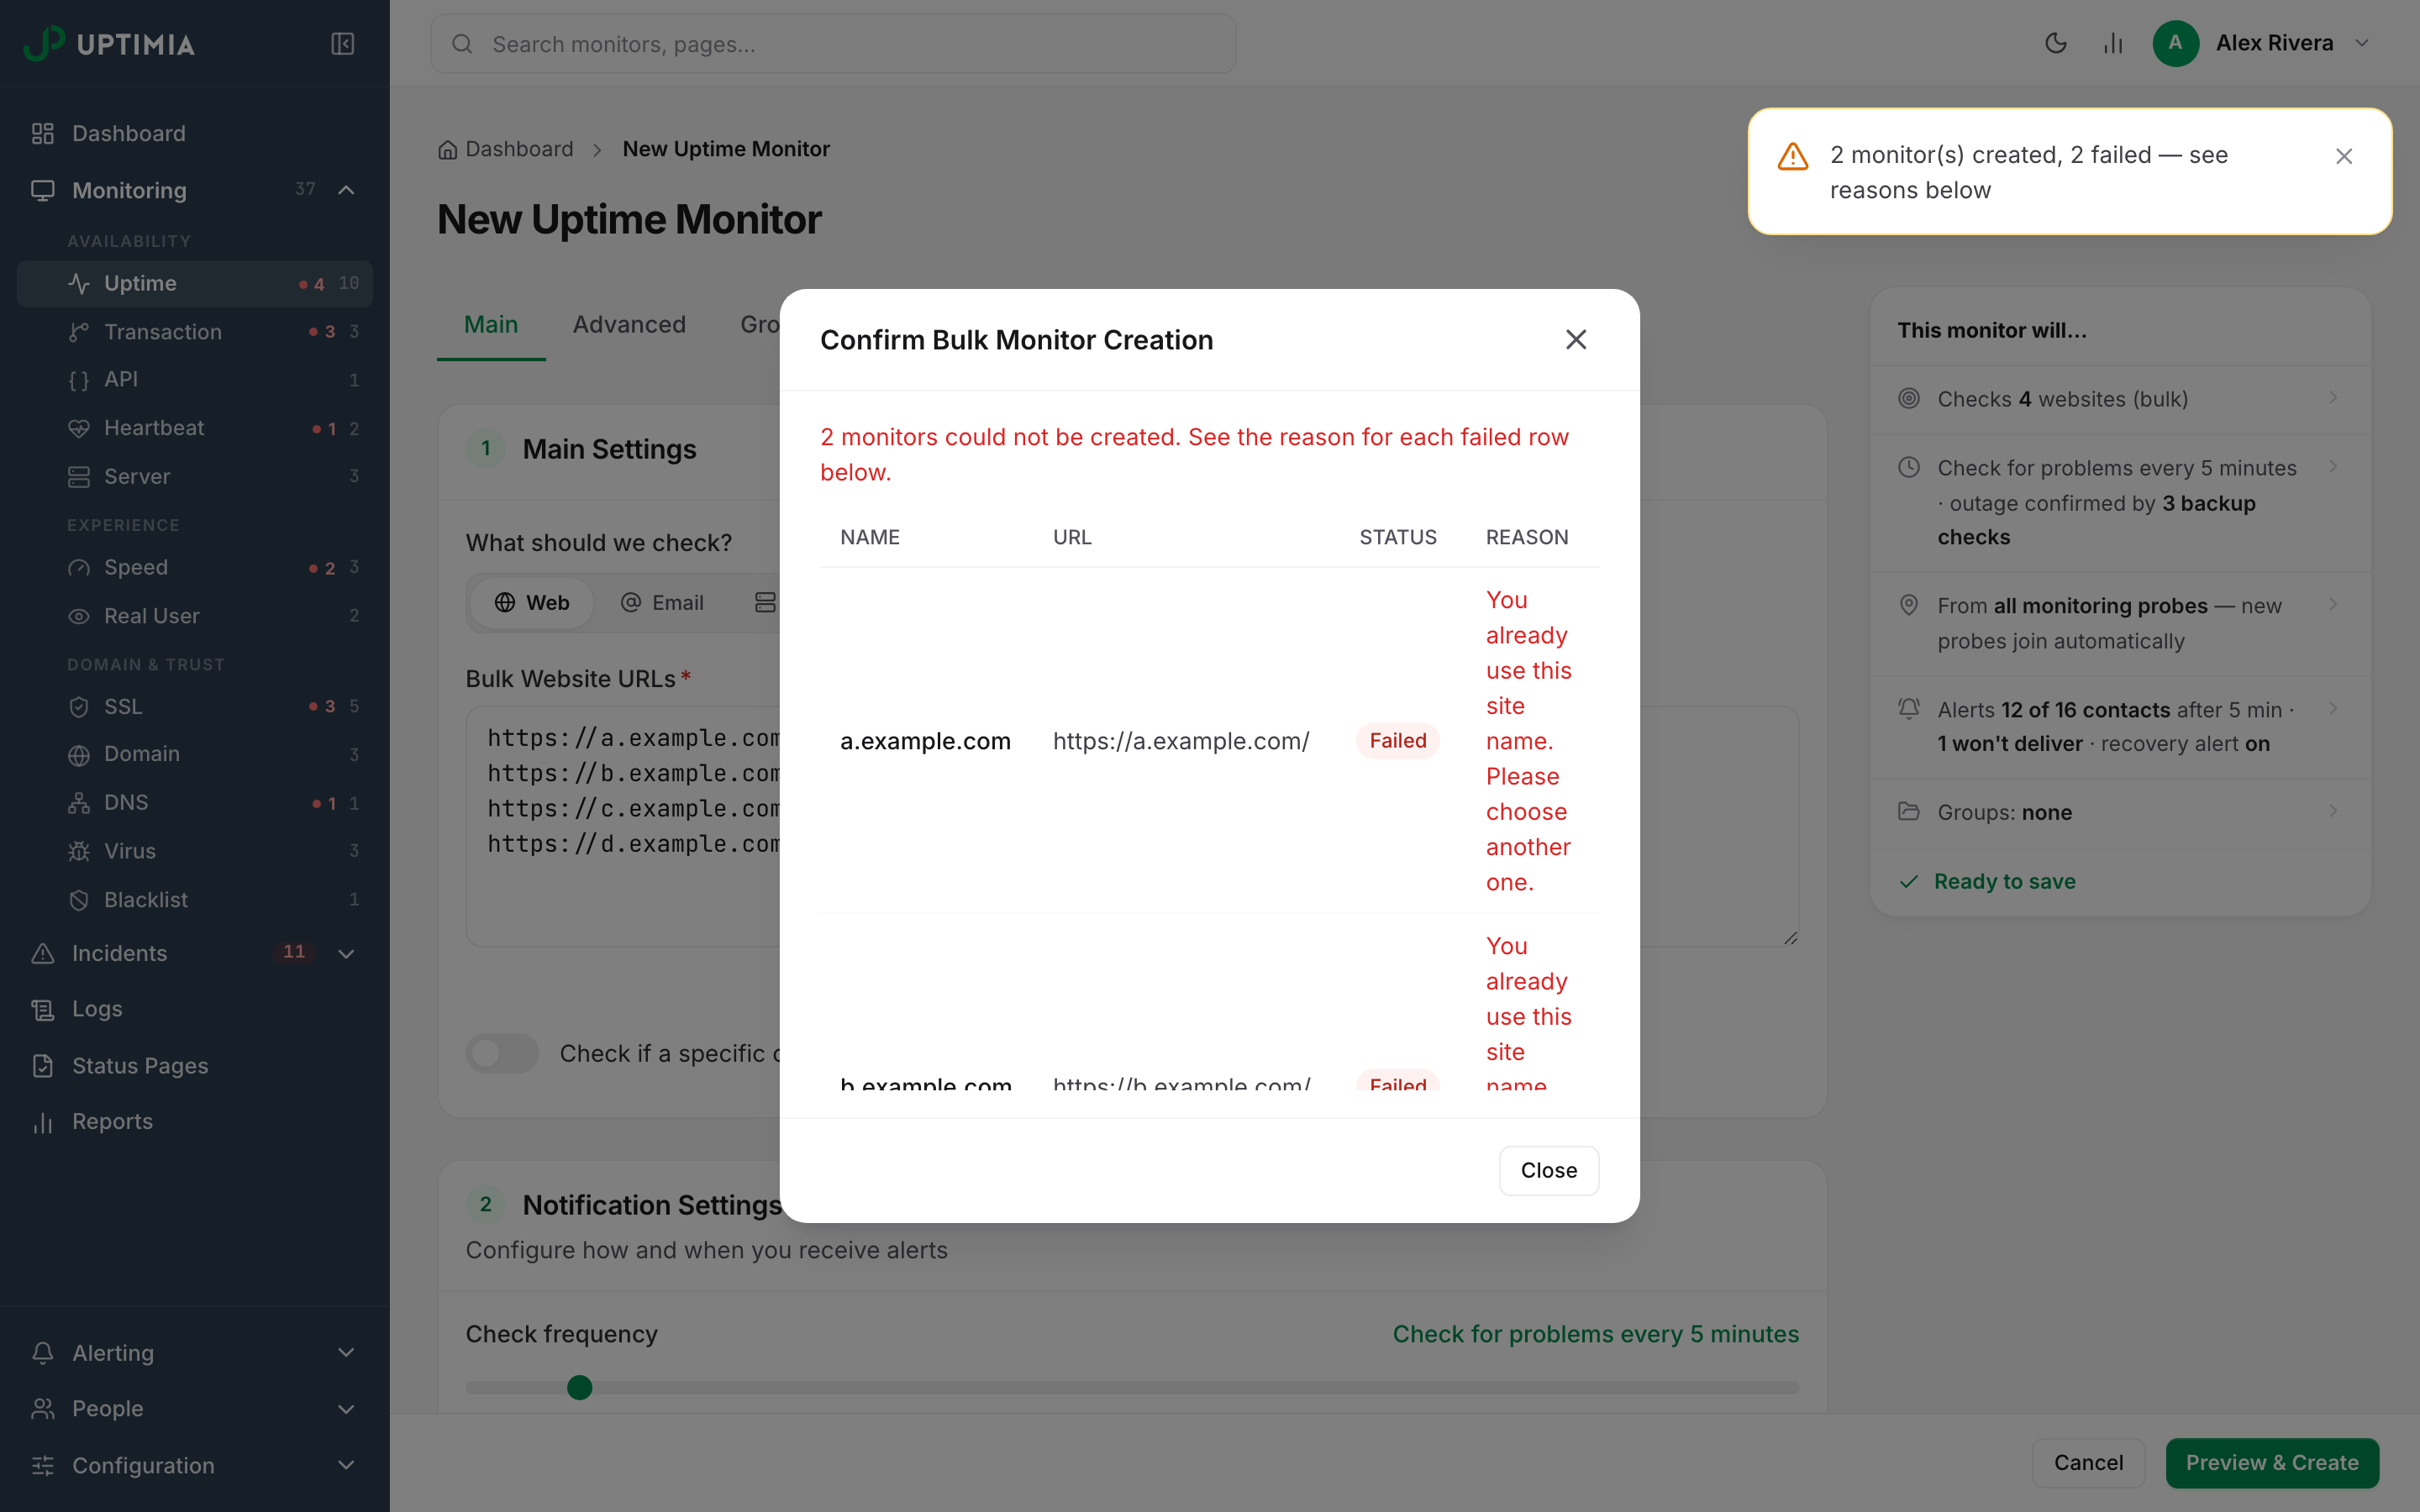
Duplicate names are refused. A row whose name already exists in that same monitor family fails with You already use this site name. Please choose another one. A bare URL takes its name from the hostname. So re-pasting a host you already monitor collides on the name (unless you renamed that monitor or gave it a name of your own), and the row is refused rather than silently duplicated. The check reads the name, not the URL, so two monitors on the same URL under different names are still allowed. It is per family, so an SSL monitor and an uptime monitor can carry the same name.
Selecting an escalation policy does not excuse an empty recipient list. Every bulk-capable family requires at least one recipient per monitor, so Uptimia blocks the batch.
When Some Rows Fail
If any rows fail, the confirmation modal stays open:
- The table gains a Reason column, carrying the message for each failed row.
- Failed rows get a red Failed badge; rows that were created keep their Valid badge.
- Close replaces the confirm button, and the toast reads N monitor(s) created, M failed — see reasons below.
- The monitors that did get created are real and already checking. They appear in the monitor list.
One reason catches people out. A URL on Uptimia's blocked-domain list is marked Valid in the preview, which checks URL format only, and the row then fails at create time with a message that depends on the family. Uptime and Speed rows fail with Please enter a valid site URL. SSL, Domain and Virus rows fail with The URL is blacklisted or invalid.
Fix the causes: rename a colliding entry, free up quota, verify your email, drop a blocked URL. Then start a fresh batch containing only the rows that failed.
Bulk Actions From the Dashboard
Select monitors on the dashboard and act on all of them at once, across types. Every family the dashboard lists can be selected together: uptime, SSL, speed, domain, virus, transaction, Real User, server, heartbeat, blacklist, DNS and API.
Selecting Monitors
- Table view: the checkbox on each row selects one monitor. The header checkbox selects every monitor on the page, and shows a partial state when only some are selected. Selected rows are highlighted.
- Grid view: each monitor card has a checkbox in its top-right corner.
- Graph view: the same per-monitor checkbox.
Filter first. Narrow the list by type, status or group, then use the header checkbox. It takes every monitor on the current page, so set the page size to All first if the filtered set runs past one page.
Available Actions
A bulk actions bar appears above the list as soon as one monitor is selected, showing the count, for example 5 selected.
| Action | What it does | When it is offered |
|---|---|---|
| Pause | Stops checking the selected monitors | When none of the selected monitors are paused |
| Resume | Resumes checking | When all of the selected monitors are paused |
| Schedule Maintenance | Opens the maintenance window form with the selection pre-filled | When none of them are in maintenance |
| End Maintenance | Takes them out of maintenance | When all of them are in maintenance |
| Delete | Removes the monitors and all their data | Always |
Pause and Resume sit on the bar as buttons. Schedule Maintenance, End Maintenance and Delete are under More. Clear on the right deselects everything.
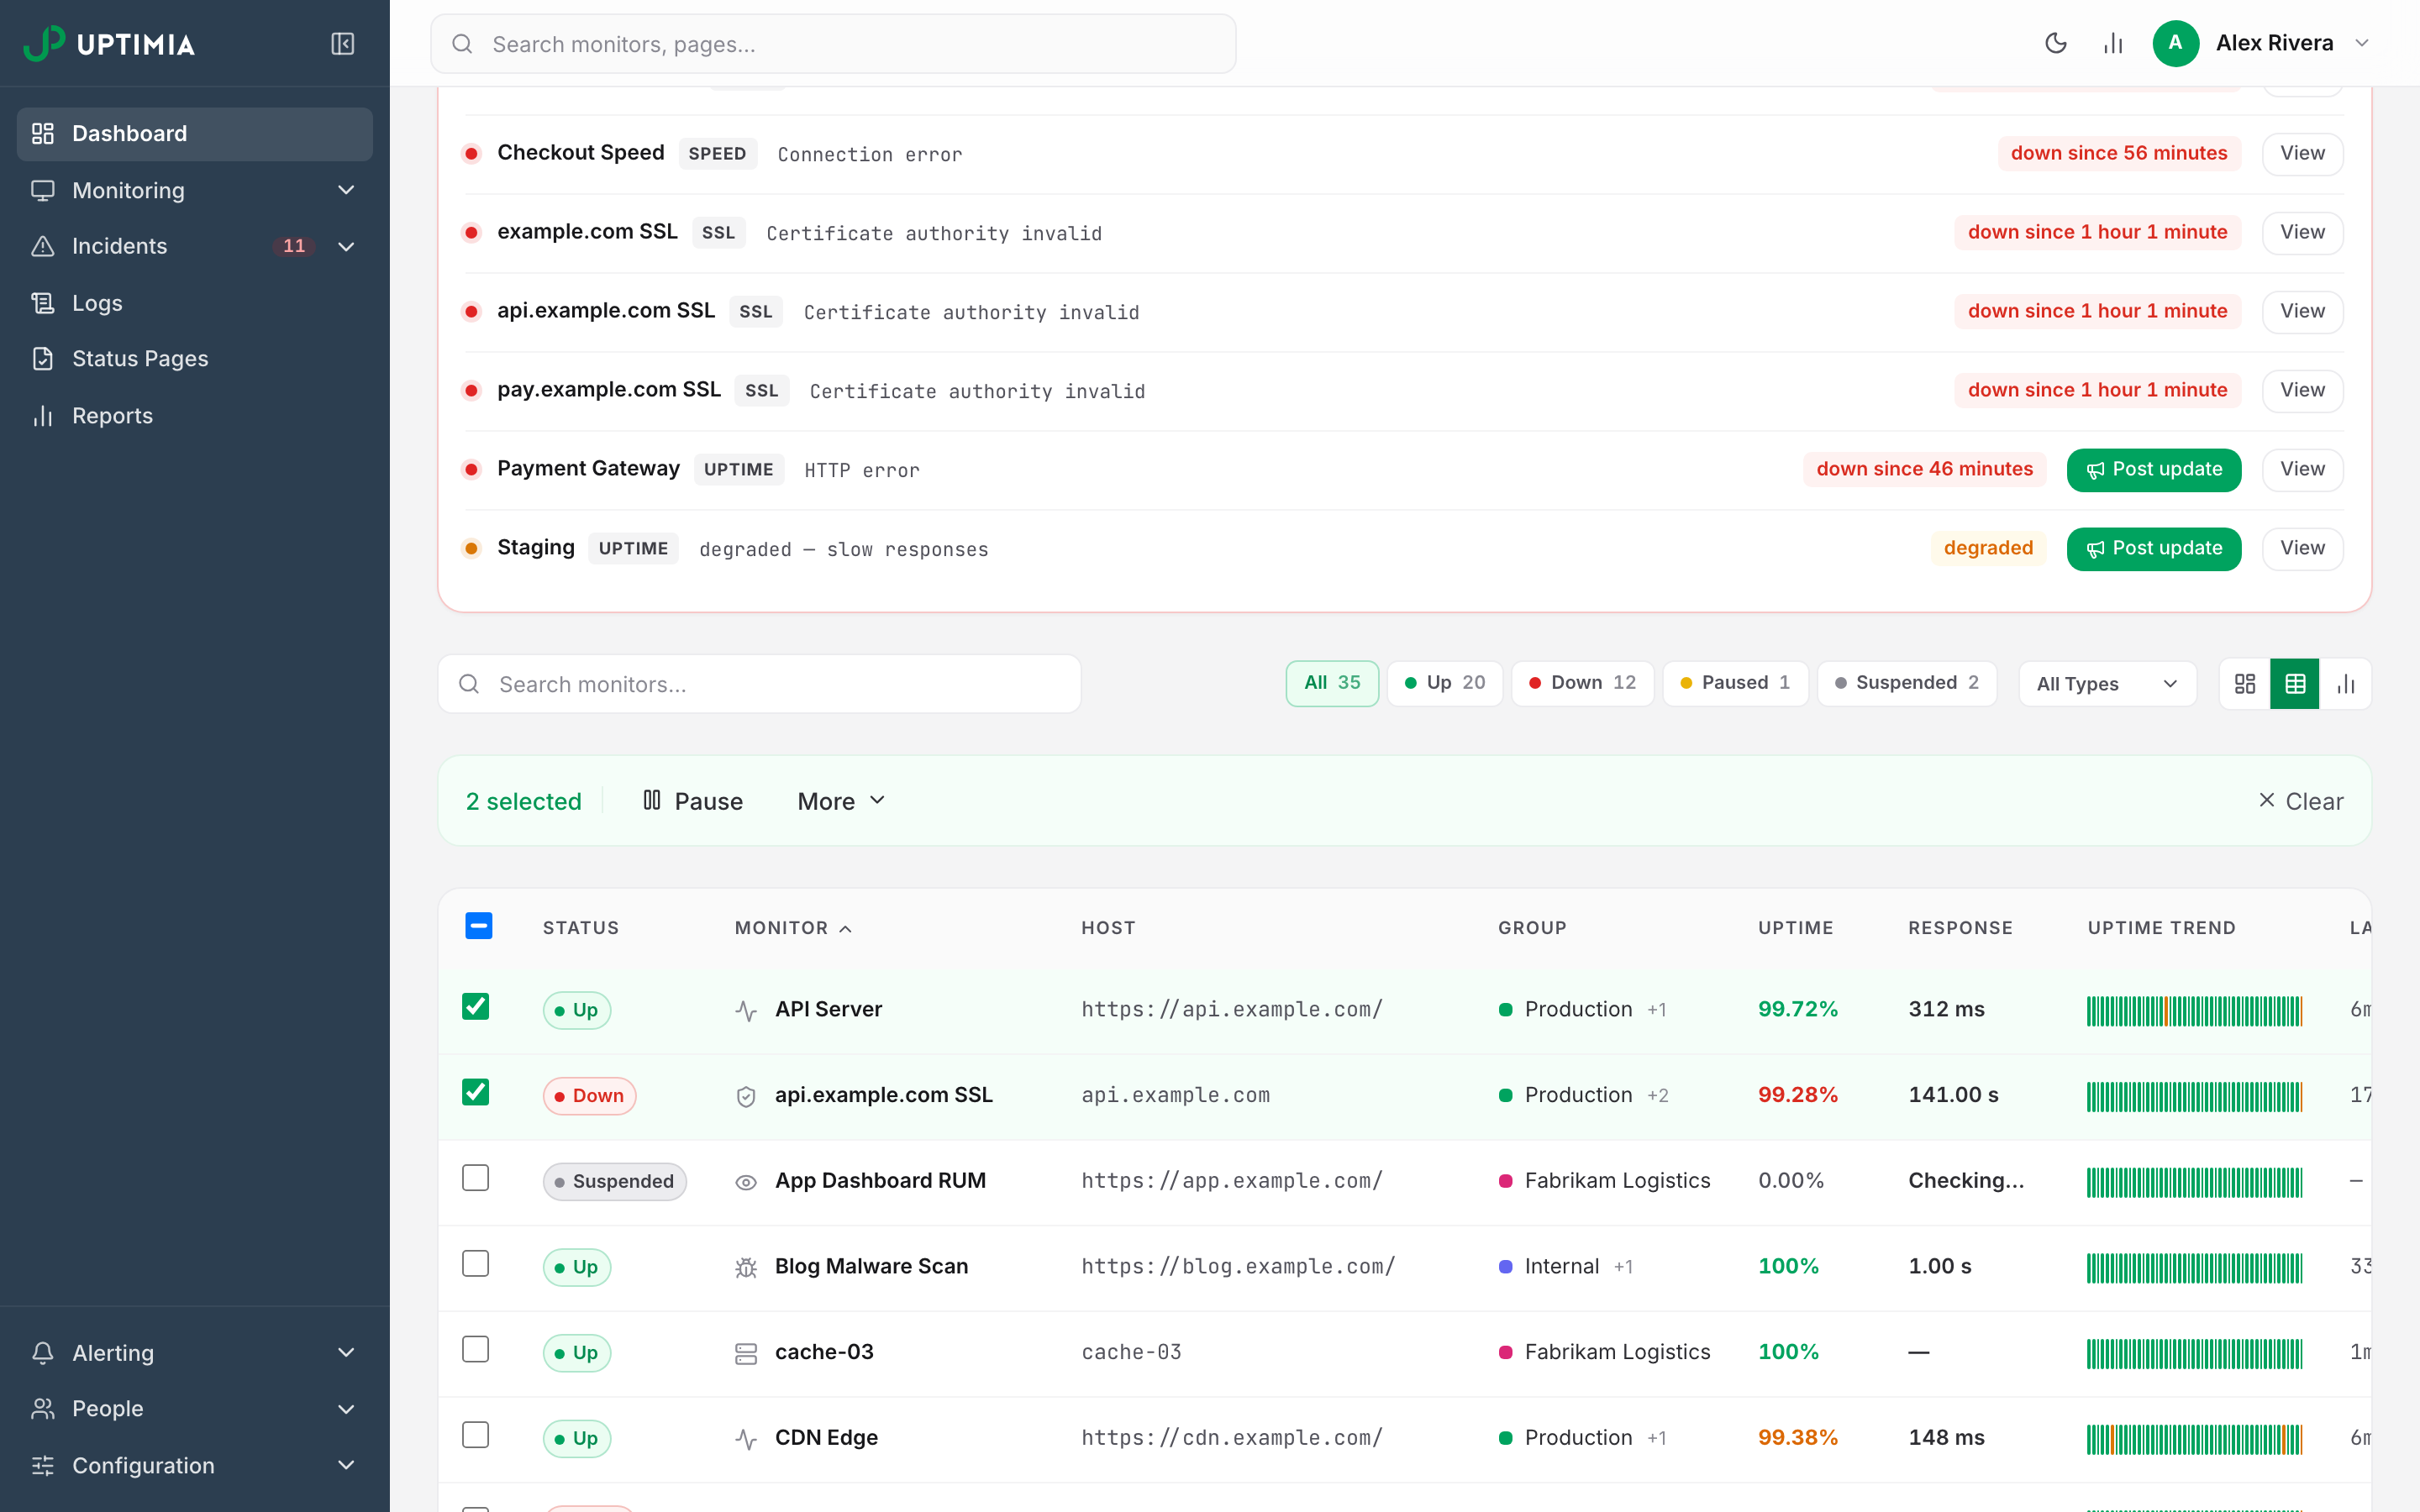
Uptimia asks you to confirm before it runs any of these actions. The modal names the action and the count: Delete 2 monitor(s)?
Warning: deleting monitors cannot be undone. The delete modal says so: This action cannot be undone. The selected monitors and all associated data will be permanently removed. Incidents, check logs and history go with the monitor.
Applying a Location Profile to Many Monitors
Go to Configuration → Location Profiles, open a profile's ⋯ menu and click Bulk apply. Built-in profiles carry the same button in their detail modal. Tick the monitors to repoint and click Apply to N monitors.
- The picker covers Uptime, Speed, SSL and Transaction monitors.
- Up to 500 monitors in one bulk apply.
- The result view reports on each monitor separately. Some rows can fail while others succeed, so read the results rather than assuming the whole apply worked.
See Location Profiles for the profile kinds, the 6-probe minimum and what happens when you edit a profile later.
Who Can Run Bulk Operations
Bulk creation and every dashboard bulk action are limited to Owner, Admin and Editor seats.
An Editor limited to specific monitor groups is confined to that scope in both directions: a bulk pause, resume, end-maintenance or delete silently skips monitors outside their groups. Monitors an Editor creates in bulk go into that Editor's own groups, so an Editor never creates a monitor they cannot see.