
Uptimia is a website and application monitoring service. It runs checks against your sites, servers and endpoints from probes around the world on the schedule you set, and when one of those probes sees a failure, Uptimia asks other locations before it wakes anyone, then pages the people you nominated. To create an account and get a first monitor running, start with Getting Started with Uptimia.
Who Uptimia Is For
Uptimia is for the people who have to know a site is down before a customer tells them:
- website owners and online stores
- agencies looking after client sites
- developers and DevOps teams
- anyone whose revenue stops when a URL stops answering
Size does not change the model. One account holds every monitor, and the same alerting rules apply whether you run one site or a thousand.
How a Check Becomes an Alert
You tell Uptimia what to watch and how often. A probe runs the check on that schedule and records the result.
Seven families confirm an outage before they alert: uptime, SSL, Speed, Domain, Transaction, API and DNS. On those, one failure is a suspicion. Uptimia re-runs the check from other locations and opens the incident once enough of them agree; Heartbeat, Server, Virus, Blacklist and Real User monitors have no backup-check step. How Uptimia Monitoring Works covers probes, consensus and backup checks.
Uptimia keeps every result as a check log row, and every confirmed failure becomes an incident with a start, an end and a duration. Both feed the uptime percentage on your dashboard and in your reports.
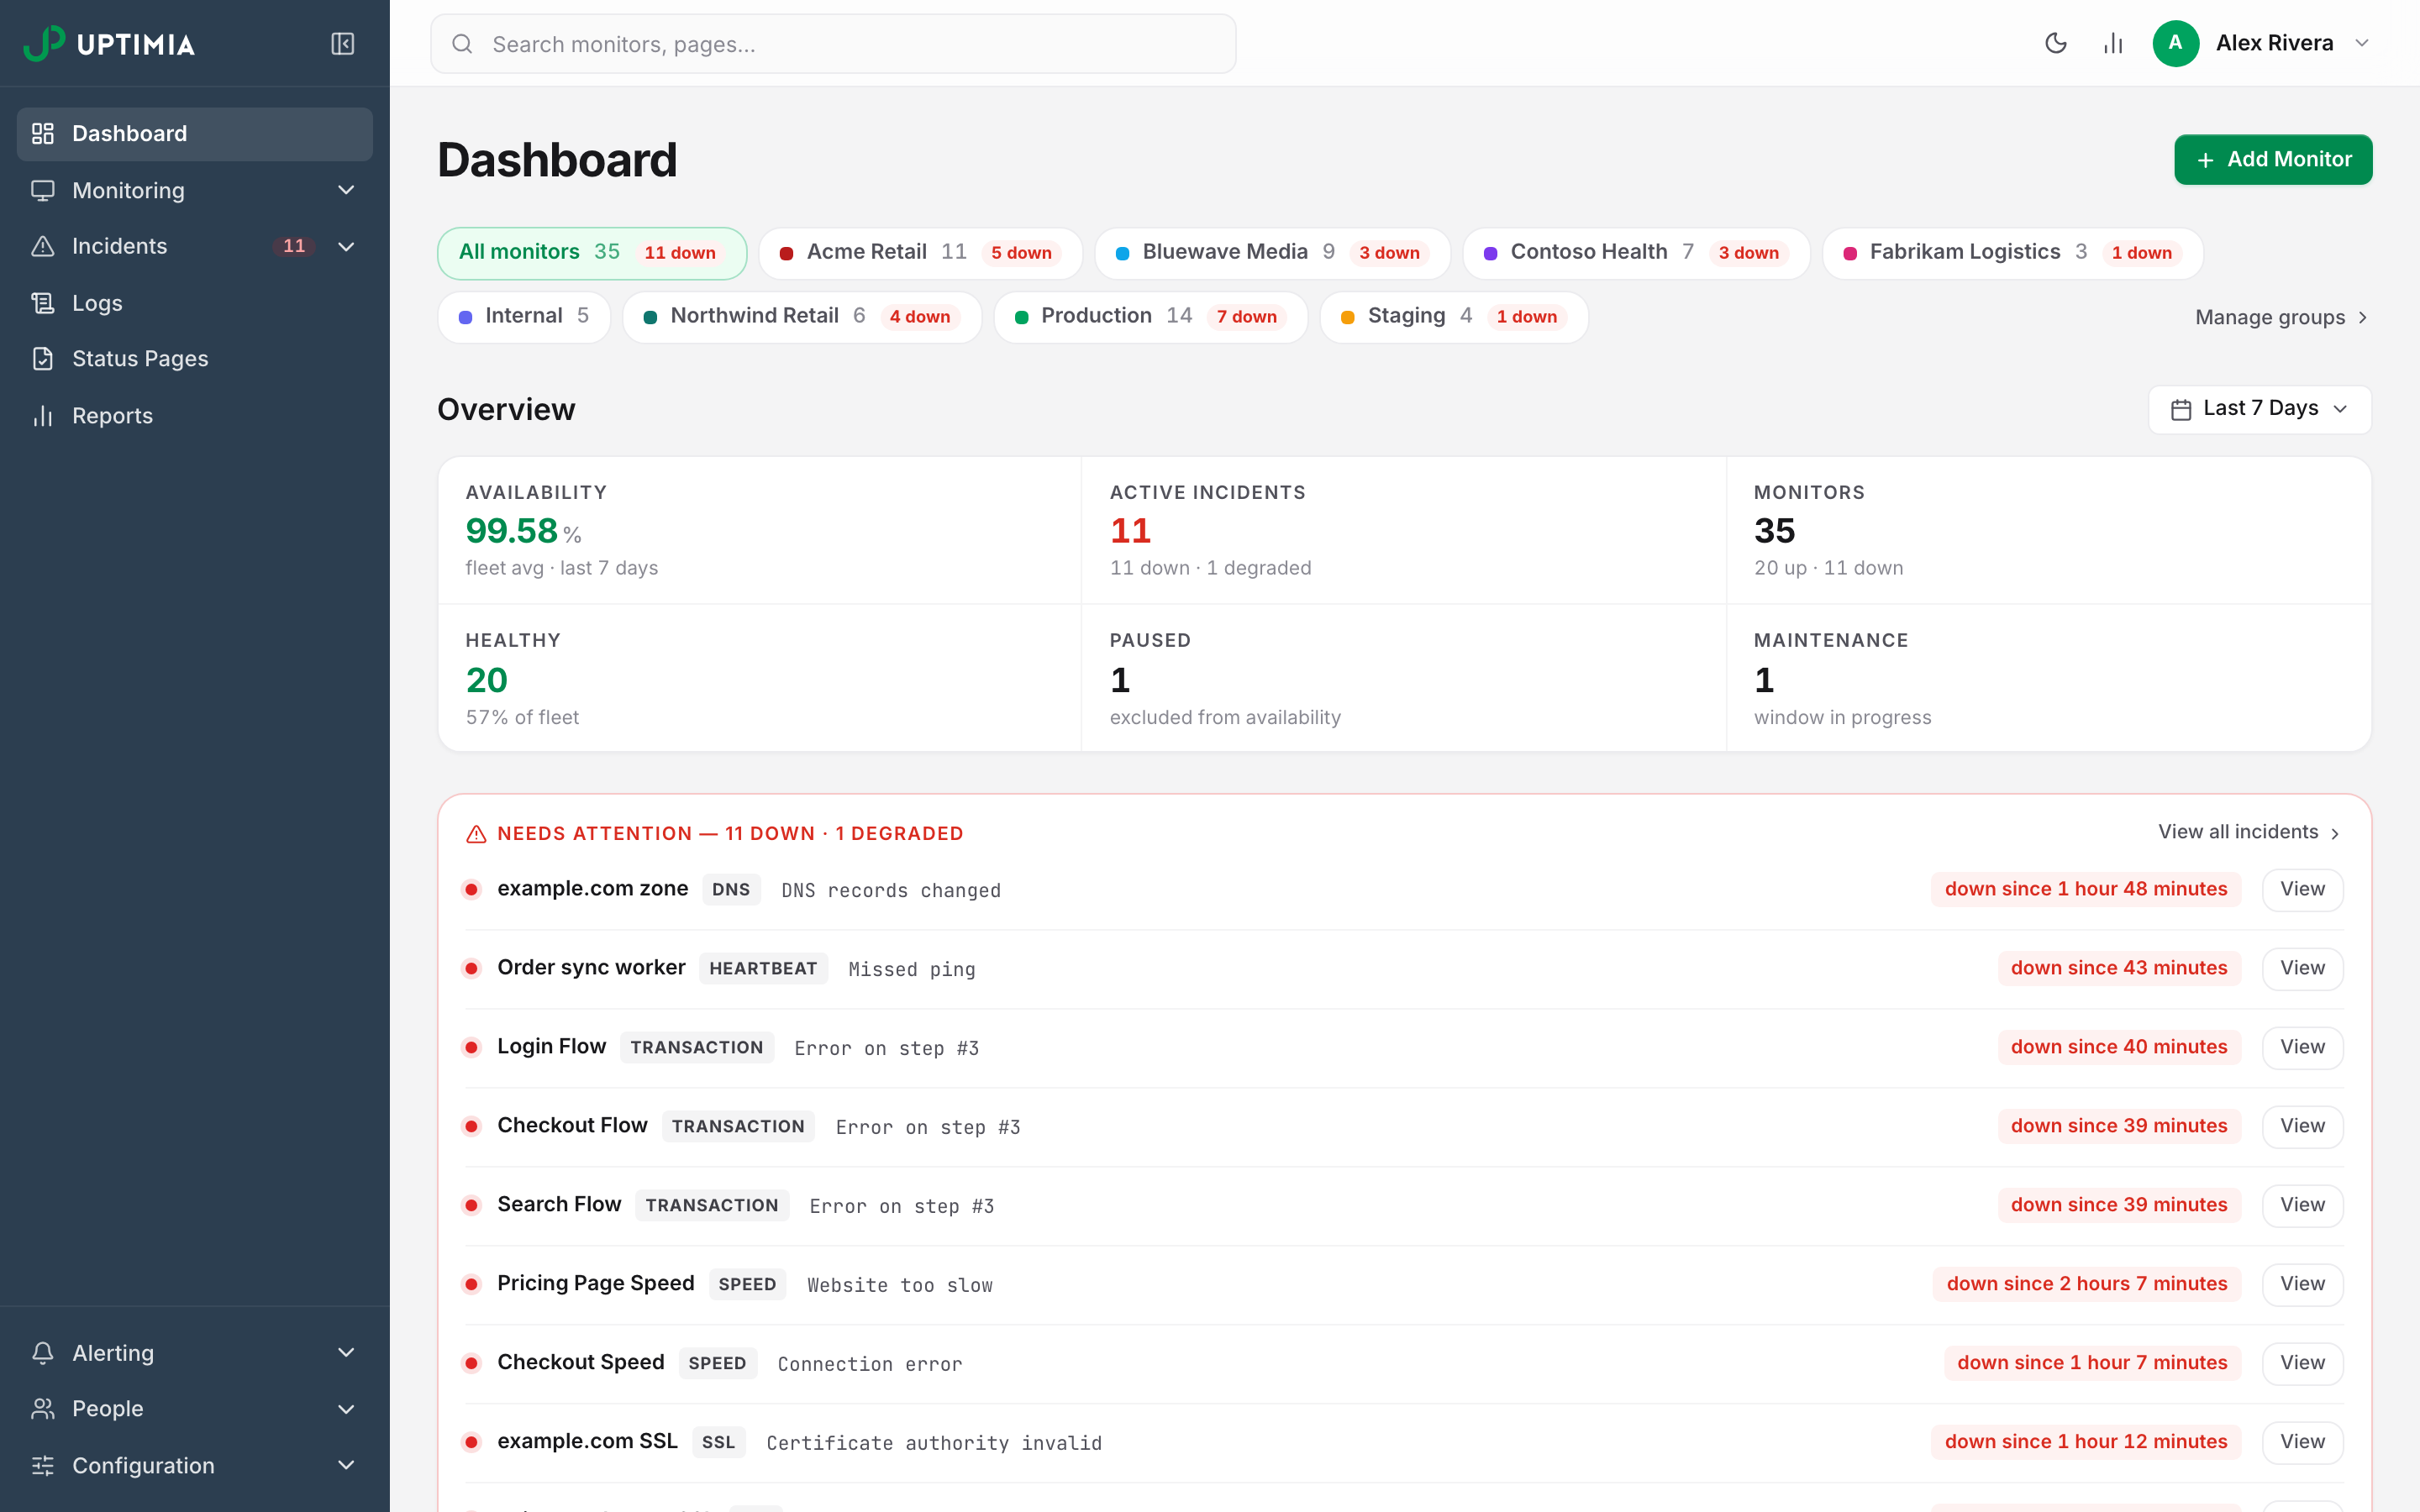
The Twelve Monitor Families
Uptimia ships 12 monitor families. Each is its own type, with its own editor and detail page, and most have their own allowance on your plan, though Speed and Transaction draw on one shared pool of advanced checks instead. Mix them freely: one site commonly has an uptime monitor, an SSL monitor and a domain monitor pointed at it.
The sidebar groups them into 3 sets. Click Monitoring to expand the list.
| Family | Sidebar group | What it watches |
|---|---|---|
| Uptime | Availability | One HTTP endpoint, TCP or UDP port, ping, DNS record or mail server, checked from your chosen probes. |
| Transaction | Availability | A recorded multi-step browser journey, such as a login or checkout, replayed on a schedule. |
| API | Availability | A series of HTTP requests run in order. Each step can check what came back and pass values to the next step. |
| Heartbeat | Availability | An inbound ping your cron job or worker sends to Uptimia, which alerts when it stops arriving. |
| Server | Availability | An agent on your host reporting CPU, memory, disk and load. |
| Speed | Experience | Full page-load timing and a request waterfall for one URL. |
| Real User | Experience | Load timings collected from the browsers of your actual visitors. |
| SSL | Domain & Trust | Certificate validity, chain and expiry for one host. |
| Domain | Domain & Trust | Registration expiry, registrar and nameserver facts for one domain. |
| DNS | Domain & Trust | One DNS zone, asked at the nameservers that own it. Uptimia checks that each nameserver answers, and tells you when a record changes from what it first recorded. |
| Virus | Domain & Trust | Malware and phishing scanning of one URL. |
| Blacklist | Domain & Trust | Checks the main email blocklists (DNSBLs) for one sending domain or IP address, so you know when your mail is blocked. |
Server is the one family some accounts never see. Its sidebar row appears when your plan includes at least one server monitor, so the Free plan hides it. Every other family is visible to everyone, up to the number your plan allows.
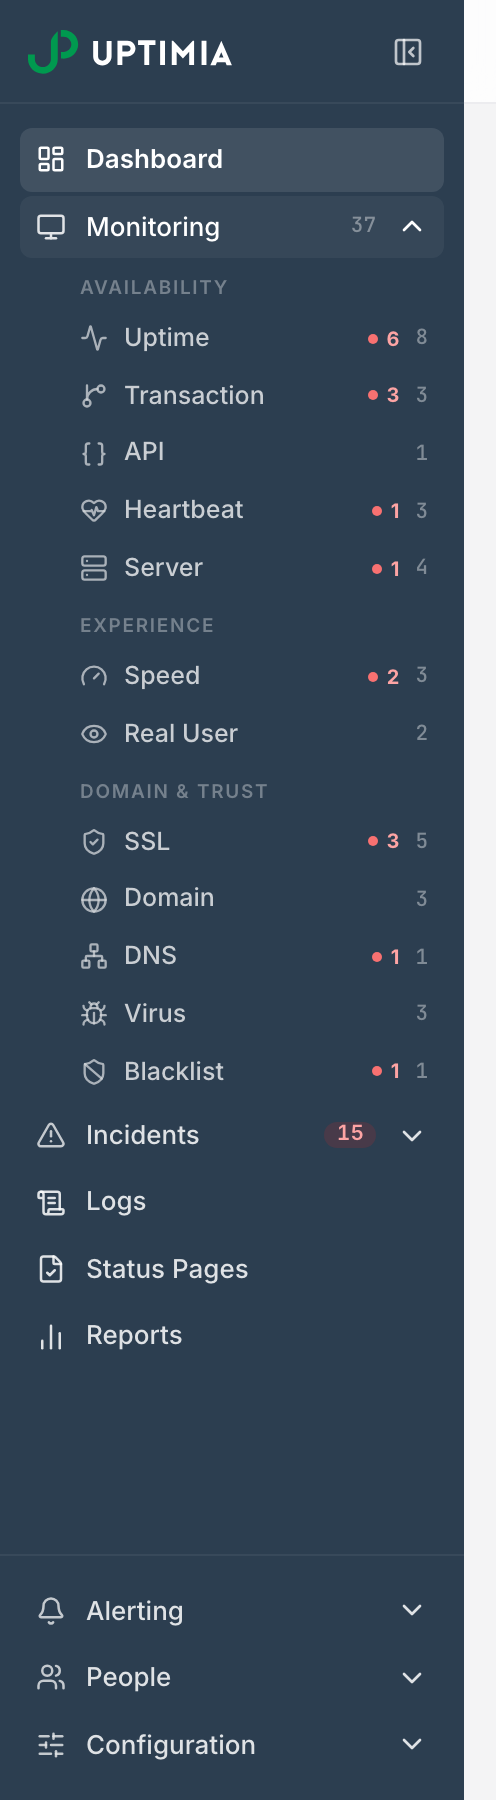
Monitoring Overview covers what each family measures. Three pairs look like they answer the same question: Uptime versus Speed, Uptime versus Transaction, and DNS versus Domain. Choosing Between Monitor Types sorts those out.
Beyond the Checks
Alerting and On-Call
A monitor sends its alerts to contacts. A contact is one destination on one channel, and the same contact is reusable across monitors. Uptimia delivers on 12 channels: Email, SMS, Slack, MS Teams, Discord, Telegram, Mattermost, Twilio, PagerDuty, Webhook, WhatsApp and Status Page (Atlassian Statuspage). Separately, every person on the account has one alerting schedule, the days and hours they may be paged, and that schedule applies to all of their contacts, whichever channel each one uses.
On-call rules sit on top of contacts. An escalation policy is a reusable ladder: step 1 pages one group. If nobody resolves the incident, step 2 fires after the wait you set, then step 3, with bounded repeats at the end. Alert grouping folds a storm of monitors that share a policy into one thread instead of one alert each, and acknowledgment lets whoever picks it up stop the ladder, from the control panel or from a signed link in the alert, with no login. Escalation policies, grouping and acknowledgment need the Professional plan or above, and the trial includes them. See Escalation Policies.
Incidents and Maintenance
Every confirmed failure opens an incident with its own page: what failed, from where, how long, and what the probes saw. Maintenance windows mute alerts and pause checking for a planned deploy, once or on a repeating schedule, and that muted time never counts as downtime: Uptimia takes it out of both sides of the uptime calculation. See Maintenance Windows.
Organizing a Fleet
Monitor groups sort a large fleet. They also decide which monitors a limited team member can see. Monitor templates save a configured monitor as a reusable starting point, so the next 20 come out identical. Location profiles save a probe selection once and reuse it across monitors, and monitor notes attach context to the monitor itself: a runbook link, a known quirk.
Accounts are multi-user, with 5 roles: Owner, Admin, Editor, Read-only and Accounting / Billing. You can limit Editor and Read-only members to specific monitor groups, and the server enforces that limit, so a restricted member cannot reach those monitors at all. The Accounting / Billing seat sees invoices and the plan, and nothing else. It does not consume a paid seat. See User Roles and Permissions.
Sharing Status and Results
Status pages publish the current state of chosen monitors to your visitors, on your own domain, with email subscribers and incident updates. Scheduled reports email uptime and performance summaries on the schedule you set, with PDF, HTML or CSV attached, branded for a client if you want. See Status Pages.
The API
Anything you can do in the control panel, you can also do through the Uptimia REST API. You create API keys from the avatar menu (top right) → Settings → API Keys, a tab only Owner and Admin see. A key carries the authority of the seat that made it: an Owner key reaches the whole account, and an Admin key runs with that Admin's permissions. See Getting Started with the Uptimia API.
Plans
Uptimia sells Free, Basic, Professional and Enterprise plans, plus a 30-day trial that needs no card. What changes across them:
- how many monitors of each family you can run
- how often checks may fire
- how far back your history stays readable
- how many SMS credits you get
- whether the on-call and white-label features are available
The full table is in Plan Limits and Quotas.
Uptimia Glossary defines the vocabulary used here, including probe, incident, consensus and scope group.