
Short answers to the questions Uptimia support hears most often, each with a link to the article that carries the detail. On a limit or a setting, the linked article is the last word. If your question is really "what does this word mean", start with the Uptimia Glossary.
Monitoring Basics
What Can Uptimia Monitor?
Twelve monitor types, grouped in the sidebar under three headings:
| Sidebar group | Monitor types |
|---|---|
| Availability | Uptime, Transaction, API, Heartbeat, Server |
| Experience | Speed, Real User |
| Domain & Trust | SSL, Domain, DNS, Virus, Blacklist |
Click Monitoring to expand the list. Server appears once server monitoring is enabled on your account. Almost every type has its own plan pool, so running out of SSL monitors does not stop you creating uptime monitors; the one exception is Speed and Transaction, which draw on a single Advanced checks pool. See Monitoring Overview.
What Is the Minimum Number of Probe Locations I Can Use?
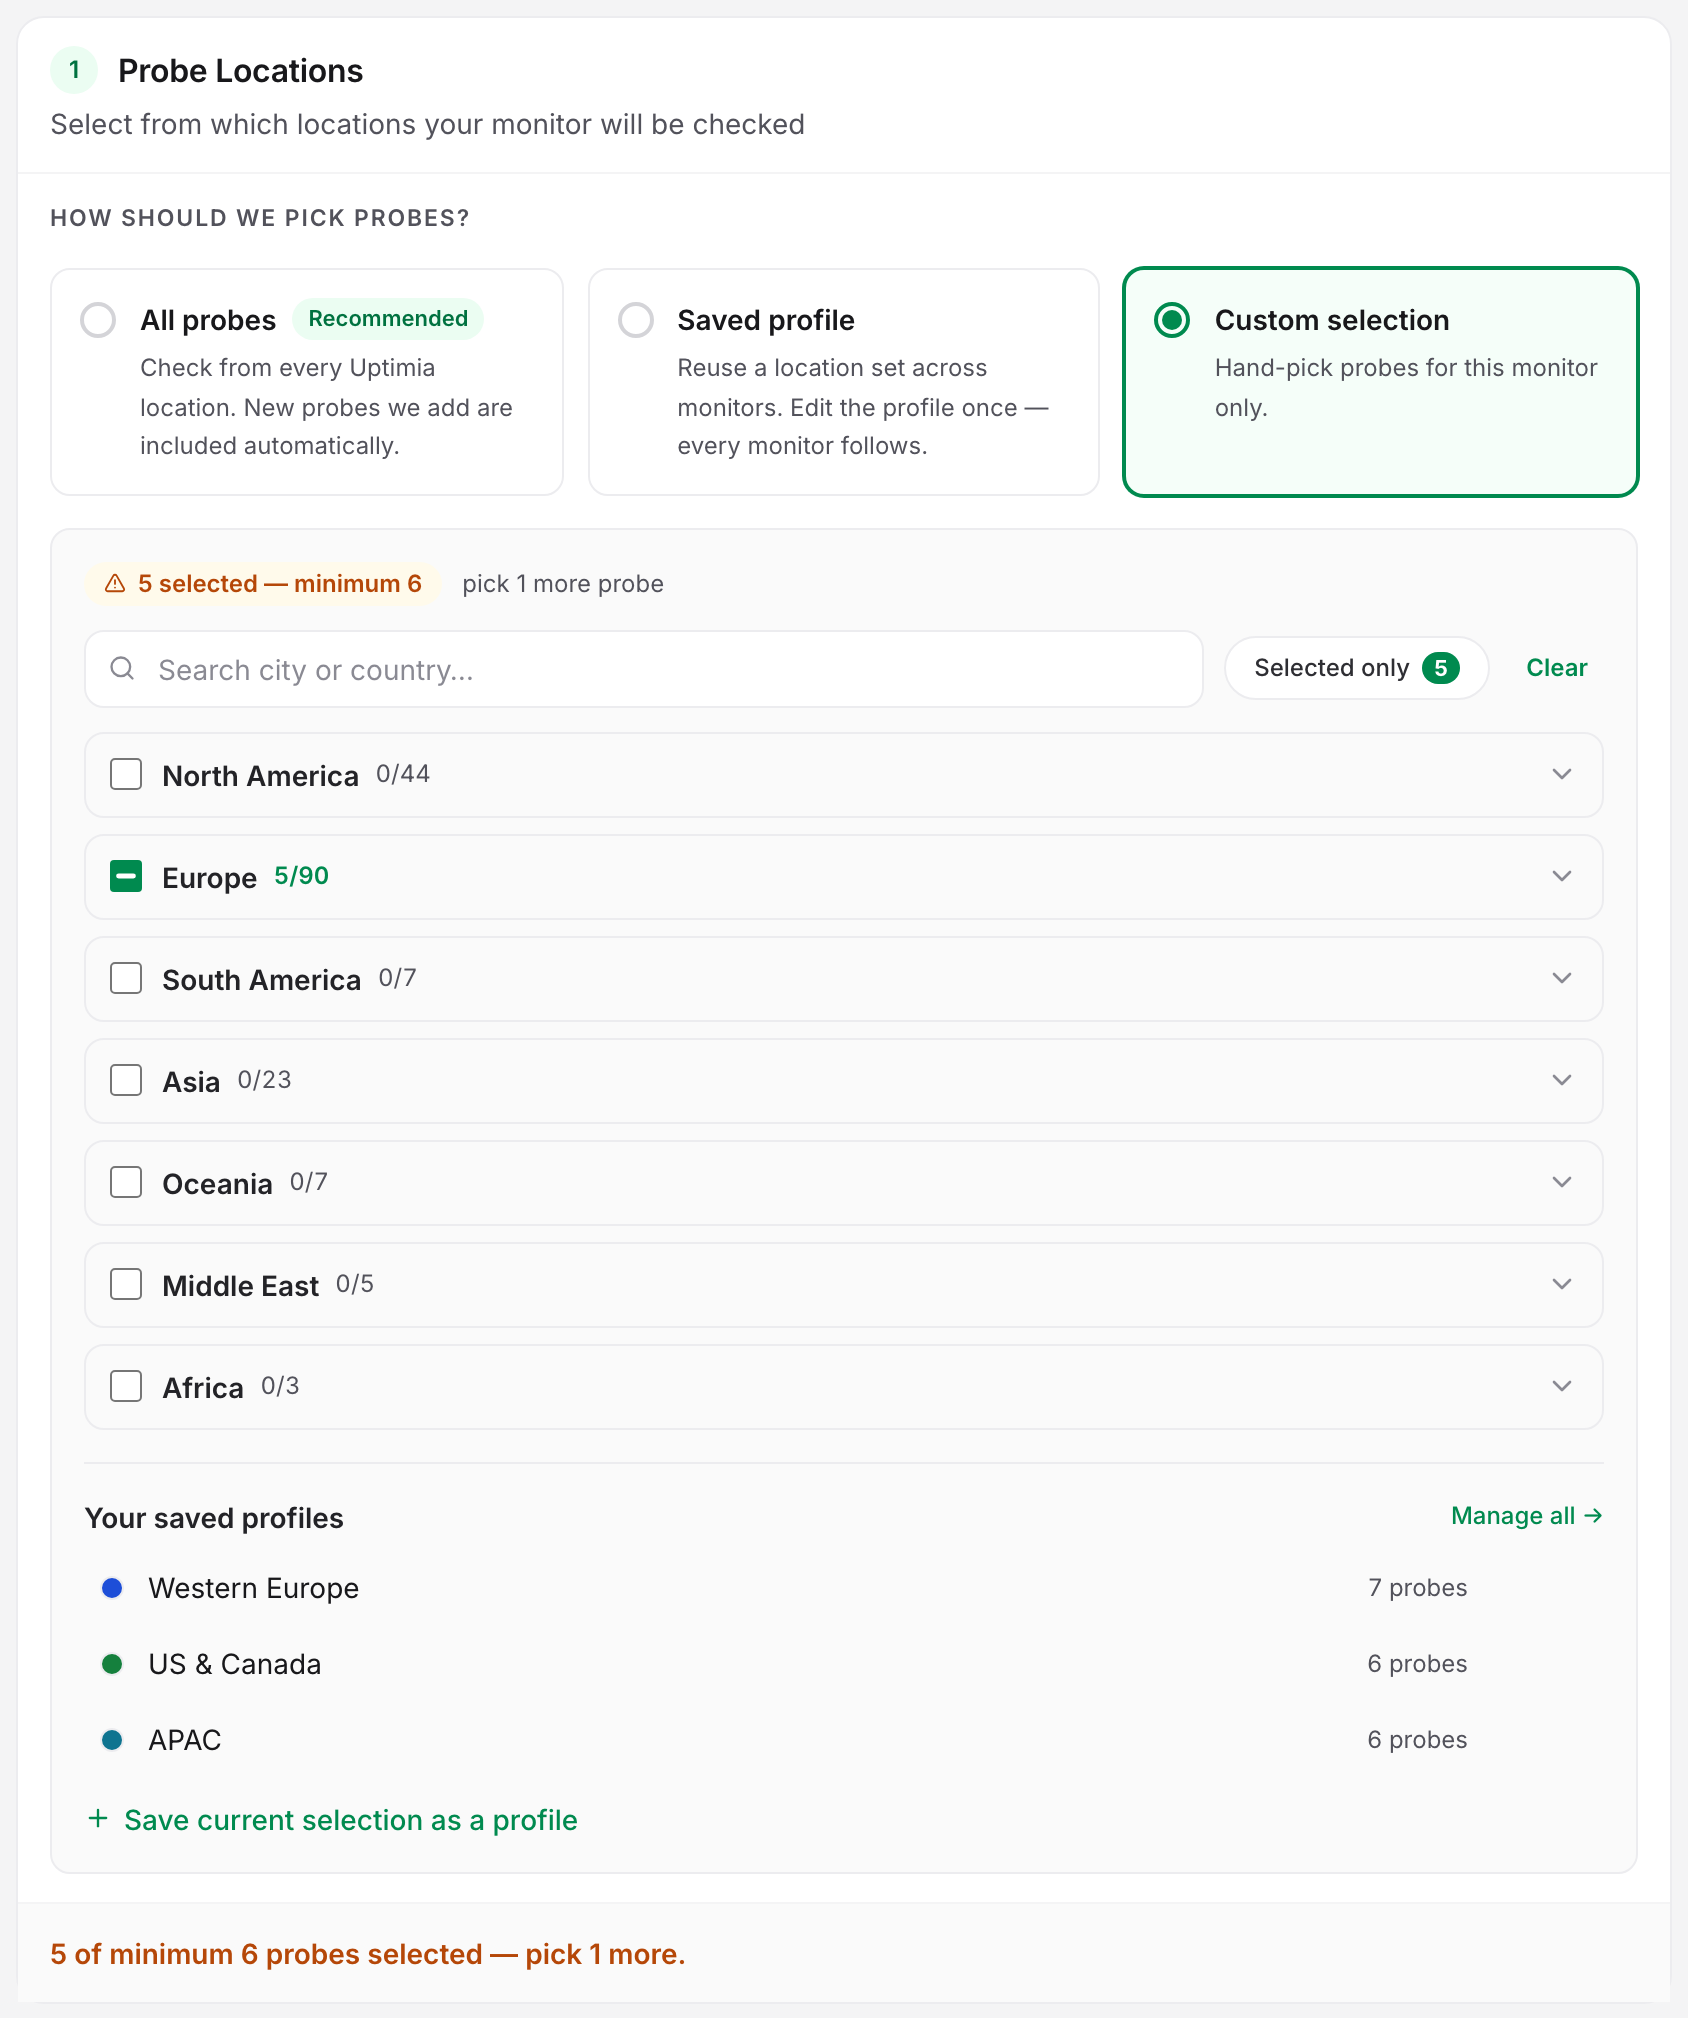
6. A monitor either checks from all probes or from an explicit selection of at least 6 probes. Pick 5 and the editor blocks the save with "At least 6 probes required — 5 selected", then jumps you to the Locations tab.
The Locations tab of the monitor editor offers three modes: All probes (recommended, and new probes are included automatically), Saved profile and Custom selection; the floor of 6 probes applies to Custom selection. If your account region is Europe, a new uptime, SSL, Speed, Transaction or API monitor pre-selects the European probe set. A dismissible banner tells you so. Switch it to All probes at any time.
How Do I Reuse the Same Probe Set Across Monitors?
Save it as a location profile, then choose Saved profile on the monitor's Locations tab. Profiles live under Configuration → Location Profiles. Seven are built in: Europe, North America, Asia, Middle East & Africa, South America, Oceania and EU / GDPR. Editing a profile's probe set rewrites every monitor still on the old set, so a profile is a live template rather than a one-off copy of the probe set. See Location Profiles.
How Do I Create Many Similar Monitors Quickly?
Three ways, shortest first. For a one-off copy, open an uptime monitor and use Copy in its Actions menu. Copy works on uptime monitors only. Use Save as Template on a fully configured monitor, then create from it under Configuration → Monitor Templates, and everything except the name and the target carries over. Or paste a list into the editor's Add Bulk field. See Monitor Templates and Bulk Operations.
If I Monitor My Root Domain, Does That Cover www and Subdomains?
No. A monitor checks the exact URL you enter and nothing else. Monitoring example.com does not cover www.example.com, app.example.com, or any path below the URL you gave it, so create a separate monitor for each address you care about. See Uptime Monitoring.
Alerts and Incidents
Why Did I Get an Alert When My Site Looked Fine?
A probe could not reach your site even though it worked for you. Common causes: a network blip on the path, a firewall or bot-defense rule refusing probe traffic, or a response slower than the monitor's timeout.
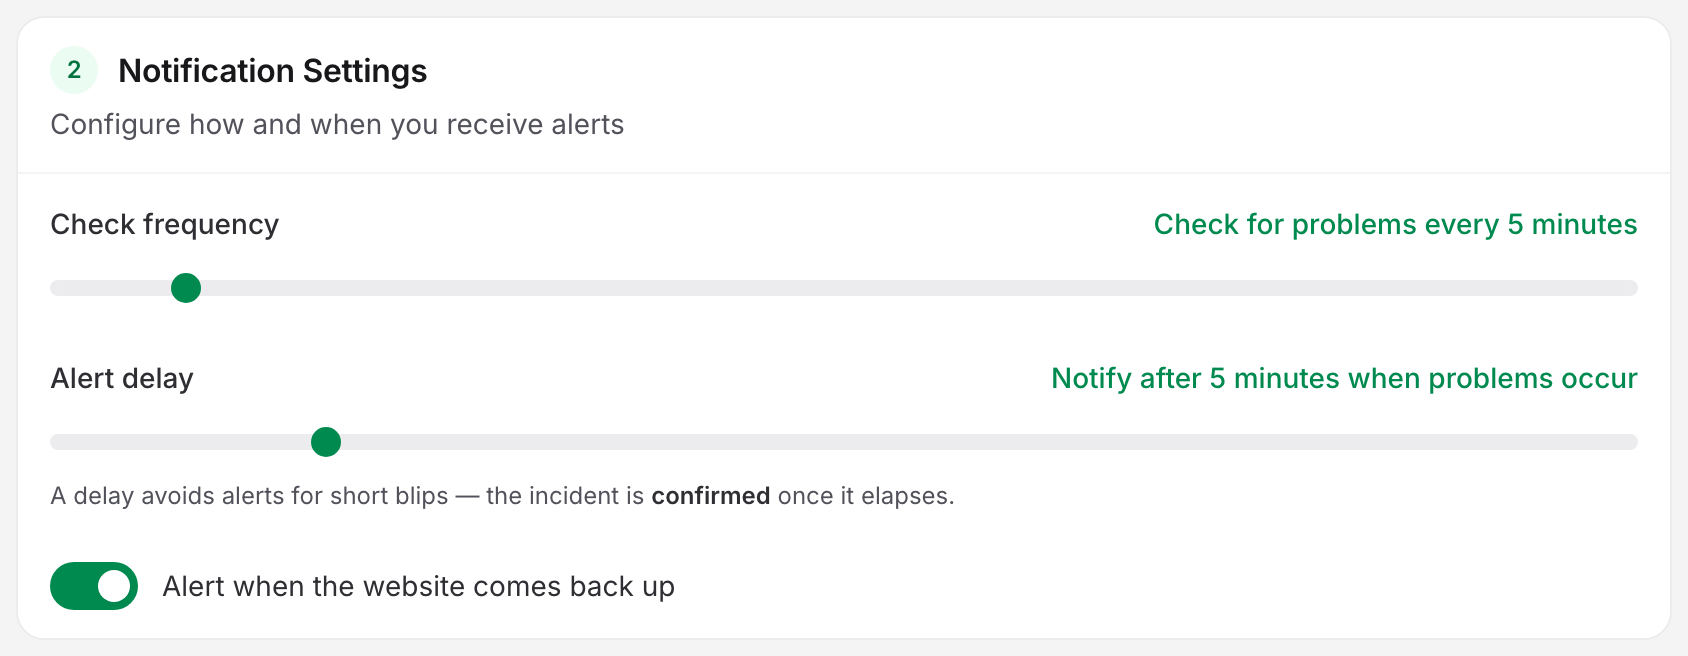
Two controls change how fast Uptimia pages you, on different tabs of the monitor editor:
| Control | Where it is | Range | Default |
|---|---|---|---|
| Alert delay | Main tab, Notification Settings card | 0–30 minutes | 5 minutes |
| Confirmations required | Advanced tab, Outage confirmation card | 1–3 | 3 |
Alert delay is time, how long a problem must persist before the incident is confirmed; Confirmations required is agreement between probes, how many backup probes must also see the failure before Uptimia confirms the outage. Lowering either makes alerts faster and noisier. See Getting Fewer, Better Alerts and, for the mechanism, How Uptimia Monitoring Works.
Where Do I See Which Probe Reported the Failure?
Open the incident from the monitor's Incidents card, or from Incidents → Active in the sidebar; each incident opens as its own page showing the root-cause detail, including which probes saw the failure and what they got back. Raw check results live in the Check log card on the monitor page, and account-wide in Logs. See Incidents and Monitoring Logs.
How Do I Stop Being Paged Repeatedly for the Same Incident?
Two features help. Both are on the Professional plan and above, and both are included in the trial. An escalation policy pages one group of people, waits, then pages the next only if nobody has responded; acknowledging an incident pauses the ladder, and the alert carries a signed link, so no login is needed. Alert grouping folds a storm of simultaneous incidents into one digest instead of one message per monitor. See Escalation Policies and Acknowledging Incidents and MTTA.
Access, Data and Billing
Can I Give Someone Read-Only Access?
Yes. Read-only is one of five roles: Owner, Admin, Editor, Read-only and Accounting / Billing. A Read-only member sees dashboards, monitors, incidents and reports, still receives alerts, and cannot change anything; Editor and Read-only members can also be limited to specific monitor groups. Open the full capability matrix from People → Users. See User Roles and Permissions.
Where Is My Monitoring Data Stored?
In EU data centers, in France and Germany. That covers customer data, monitoring results and billing records alike, and where the data rests is separate from where your checks run from, which you choose per monitor on the Locations tab. See Security, Privacy and Compliance.
How Far Back Does My History Go?
| Plan | History window |
|---|---|
| Free | 7 days |
| Trial | 30 days |
| Basic | 90 days |
| Professional | 365 days |
| Enterprise | 730 days |
If you ask for a longer range, you get your plan's window instead of an error. The window controls what you can read, and it deletes nothing itself. A nightly cleanup removes rows, and it keeps every kind of data at least as long as your plan's window: on Basic and Professional it removes uptime check logs exactly at the window and keeps everything else well past it. Upgrading widens the readable window immediately and retroactively, because the older rows are still there. See Data and Log Retention.
How Many Monitors Do I Get?
The pool is per type and per plan, and Speed and Transaction share a single pool called Advanced checks. The full table lives in Plan Limits and Quotas. Your current usage is on the dashboard's plan card.
Which Countries Can Receive SMS Alerts?
Built-in SMS delivers only to an allowlist of country codes. Any number starting +1, +3 or +4 is accepted, plus +54, +55, +56, +61, +63, +64, +65, +81, +82, +90, +91, +598, +852, +886, +968, +971 and +973.
+374 and +375 are rejected by name. Every code that is not on the list is refused the moment you save the contact, with Your phone number or country is not supported, and that includes +7 (Russia and Kazakhstan), which is blocked a second time at send time. For a destination the allowlist does not cover, send through your own gateway instead.
New SMS contacts are saved already confirmed, so a new number needs no code. A contact whose Status column still reads Unconfirmed is a legacy row. It carries a Verify button beside the badge that texts a 6-digit code; type the code into the box that replaces the badge and click OK. Sending that code costs one SMS credit, the same as an alert. See SMS Alerts.
Can I Buy More SMS Without Upgrading?
There is no SMS top-up to buy. On a paid plan, your plan sets the allowance and refills it on the 1st of each month, and the refill overwrites the balance rather than adding to it, so unused credits do not roll over. Free and trial accounts sit outside that cycle. Uptimia grants a trial 20 credits once at signup and never refills them. If you need more volume than your plan grants, connect your own Twilio account. Twilio bills you for messages sent through that integration, and they do not touch your Uptimia credits. See Twilio SMS and Voice.
What Happens When My Trial Ends?
Uptimia downgrades the account to Free rather than closing or canceling it. Free gives you 1 uptime monitor, 1 API monitor, checks no more often than every 5 minutes, and 7 days of history, so monitors above those pools are suspended rather than deleted. See When Your Trial Ends.